Photo: Carol M. Highsmith, Library of Congress, public domain, via Wikimedia Commons, cropped
Average True Range (ATR) is the average of how far price moves in a day over a set number of days. J. Welles Wilder Jr. introduced it in his 1978 book New Concepts in Technical Trading Systems, according to StockCharts ChartSchool, and most charting platforms today default to 14 periods. Traders use it to decide how far from the entry to place a stop loss and how many shares to buy.
ATR has no direction. A rising ATR means price is swinging more widely, not that it is about to rise or fall. It is also measured in price, not percent, so raw values cannot be compared across instruments: on October 23, 2026, Tesla's ATR was $12.58 and SPY's was $7.22, even though Tesla's share price was less than half of SPY's. This guide computes ATR from real daily bars for four US instruments, SPY, Apple (AAPL), NVIDIA (NVDA) and Tesla (TSLA), between October 2025 and October 2026. It then shows how stop distance and position size change with ATR, and which market rules can distort it.
What Is Average True Range (ATR)?
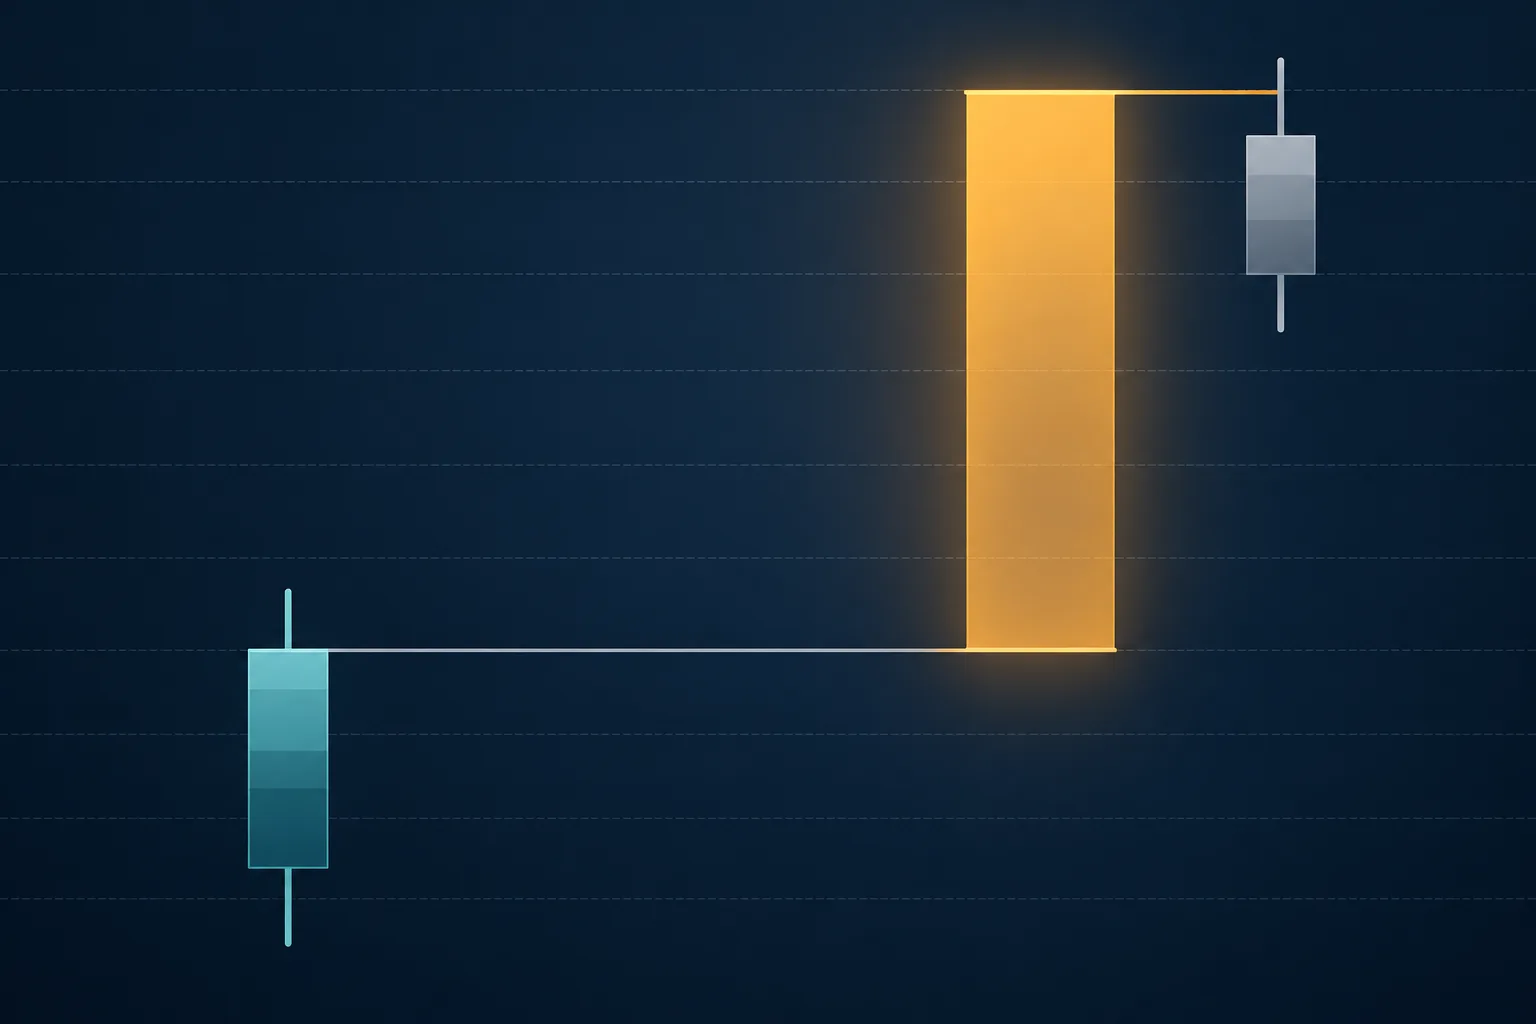
Wilder's starting point was that a day's high minus its low misses gaps. When a stock opens far above the prior close, its intraday range can be small even though price has moved a long way since yesterday. So he defined the True Range (TR), which also measures the day's movement from the prior close, and called the average of TR the Average True Range. StockCharts notes that he designed it with commodities and daily prices in mind, where gaps and limit moves are common.
ATR answers one question: how much has this instrument typically moved over the last few days, in price units? That makes it a ruler for distances, such as how far away to put a stop or a target and how large a position to take. It is not a buy or sell signal.
For the same reason, a low ATR does not make a stock safe, and a high ATR does not make it dangerous. Volatility shifts over time, but it also tends to persist: Benoit Mandelbrot observed in 1963 that large price changes tend to be followed by large changes of either sign, and small changes by small ones. That persistence is why a recent average of daily ranges is a useful guide to the next few days. As the sections below show, even SPY's ATR as a percent of price ranged from 0.71% to 1.64% within a single year.
True Range: The Largest of Three Distances
True Range is the largest of these three values.
Three real Tesla daily bars show the difference. Prices are in US dollars.
On July 23, 2026, the high-low range was $26.38, but price traveled $58.27 from the prior close of $374.01 down to the low of $315.74. The high-low range alone caught less than half of that day's move. The November 24, 2025 gap up shows the same effect in the other direction: a $20.63 bar, but a $30.63 move from the prior close to the high. The more often an instrument gaps, the further True Range and the plain high-low range drift apart.
Calculating ATR: Wilder Smoothing vs. SMA and EMA
Wilder's method has two steps. The first ATR value is the simple average of the first 14 True Range values. From the next day on, multiply yesterday's ATR by 13, add today's TR and divide by 14.
ATR(today) = (ATR(yesterday) × 13 + TR(today)) ÷ 14
Tesla's ATR(14) on July 22, 2026 was $16.06. The next day's TR was $58.27, so the July 23 ATR is (16.06 × 13 + 58.27) ÷ 14 = $19.07. A True Range about 3.6 times the prior ATR lifted ATR by only about 19% in one day.
Because the newest value gets a weight of just 1/14, ATR barely reacts to one wild day. The trade-off is that it takes several days to reflect a real change in volatility.
Charting platforms do not all smooth the same way, so the same True Range values can give different answers.
The lowest and highest readings are about 15% apart. The gap is not unique to this example: in 2011, StockCharts showed the Dow's ATR(14) at 221.762 with Wilder smoothing against 206.98 on a site that used a simple average. A standard 14-period EMA weights the newest value at 2/15, almost twice Wilder's 1/14, so it responds faster to a run of large days like July 2026. With a 2×ATR stop, switching the smoothing method alone moves the stop by about $5.44.
When you log ATR in a trading journal, record the period and the smoothing method next to the value. That way you can recompute it on the same basis at review.
The calculations in this guide use the following basis.
- Data: Alpaca daily bars, as used for the charts on this site. None of the four instruments had a stock split in the window, so prices are continuous.
- Method: Wilder smoothing over 14 periods. The first ATR is the average of the first 14 True Range values from daily bars starting April 9, 2025, so every value from October 2025 on has more than 100 sessions of smoothing behind it.
- Reference date: the comparison tables use the October 23, 2026 close.
- Rounding: values are computed from unrounded prices and ATR and rounded only for display, so recomputing from the figures shown can differ by a cent or two.
Use ATR% to Compare Instruments and Periods
Because ATR is in price units, comparing instruments at different prices requires ATR%: ATR divided by the closing price, which the TA-Lib library calls NATR. Here are the four instruments' ATR(14) readings at the October 23, 2026 close.
| Instrument | Close | ATR(14) | ATR% | 5% stop distance in ATR | 1-year ATR% range (median) |
|---|---|---|---|---|---|
| SPDR S&P 500 ETFSPY | $759.97 | $7.22 | 0.95% | 5.26 ATR | 0.71–1.64% (1.08%) |
| AppleAAPL | $347.73 | $6.41 | 1.84% | 2.71 ATR | 1.46–3.24% (2.17%) |
| NVIDIANVDA | $210.96 | $6.06 | 2.87% | 1.74 ATR | 2.36–4.83% (3.27%) |
| TeslaTSLA | $372.22 | $12.58 | 3.38% | 1.48 ATR | 2.94–6.03% (3.91%) |


The 1-year range is the lowest and highest daily ATR% between October 1, 2025 and October 23, 2026.
On SPY, a 5% stop sits more than five average daily moves away from the entry. On Tesla, the same 5% stop is less than one and a half average daily moves away. A fixed-percent stop therefore gives each instrument a very different amount of room, and in a volatile stock a single busier-than-average day can reach it.
ATR% also shifts within one instrument, even in mega-caps and an index ETF. Each of the four had an ATR% at least about twice as high on its most volatile day of the year as on its calmest: 2.3 times for SPY, 2.2 times for Apple, 2.0 times for NVIDIA and 2.1 times for Tesla. The chart below shows Tesla's daily candles over the year, with markers on its most volatile and calmest days by ATR%.
Chart data
Chart summary: Tesla (TSLA) daily candles, 2025-10-01 to 2026-10-23. Close 459.46 USD → 372.22 USD (-19.0%); period high 498.83 (2025-12-22), low 297.38 (2026-07-29). Marked: ATR 6.0% 2026-07-24 close 313.03, ATR 2.9% 2026-10-13 close 375.23.
Chart note: Tesla closed at $459.46 on October 1, 2025, reached an intraday high of $498.83 on December 22, 2025, and fell to a low of $297.38 on July 29, 2026. In July 2026 it dropped from a $425.30 close on July 1 to $311.21 on July 31, with two sessions whose True Range was at least 8% of the close: July 2 at 10.9% and July 23 at 18.2%. ATR% peaked at 6.03% on July 24 and was lowest at 2.94% on October 13.
Setting an ATR Stop Loss
The basic method places the stop a multiple (k) of ATR away from the entry. For a long trade, stop = entry − k × ATR. Two well-known versions follow this pattern.
A small k gets you stopped out by ordinary noise more often. A large k means a bigger price loss each time the stop is hit.
As the next section shows, though, the position can shrink as the stop widens, so the money at risk stays the same. That makes k less a decision about how much to lose and more a decision about how much normal movement the trade should be able to absorb.
Multiples between 1.5 and 3 are common: Fidelity gives 1.5 × ATR as an example, the Turtles used 2N, and the Chandelier Exit uses 3. No single value is correct. Record k in your journal, then check whether stopped-out trades later moved back in the original direction; that is how you find a value that fits your own trading. The full Turtle rules are covered in Turtle Trading Rules Explained and Building a Trend-Following System.
The following example is hypothetical and shows the arithmetic only, not a trade recommendation. Suppose a long entry in SPY at the October 23, 2026 close of $759.97, when its ATR(14) was $7.22. A 5% stop sits $38.00 below the entry at $721.97, which is 5.26 ATR away. A 2×ATR stop sits $14.44 below the entry at $745.53.
Chart data
Chart summary: SPDR S&P 500 ETF (SPY) daily candles, 2026-04-01 to 2026-10-23. Close 655.24 USD → 759.97 USD (+16.0%); period high 781.62 (2026-10-06), low 645.11 (2026-04-02). Marked: 2x ATR stop 2026-04-01 close 655.24, 5% stop 2026-04-01 close 655.24.
Chart note: SPY's daily low last reached the 2×ATR stop level of $745.53 on July 31, 2026, and the 5% stop level of $721.97 on June 26, 2026. A fixed 5% stop would sit at a price SPY had not traded at in about four months, which gives the trade far more room than an ordinary day's move requires. For a low-volatility ETF, a fixed 5% stop is a very wide stop.
ATR Position Sizing
Once the stop distance is set, the position size comes from dividing the money you are willing to lose by the risk per share.
Shares = risk budget ÷ (k × ATR)
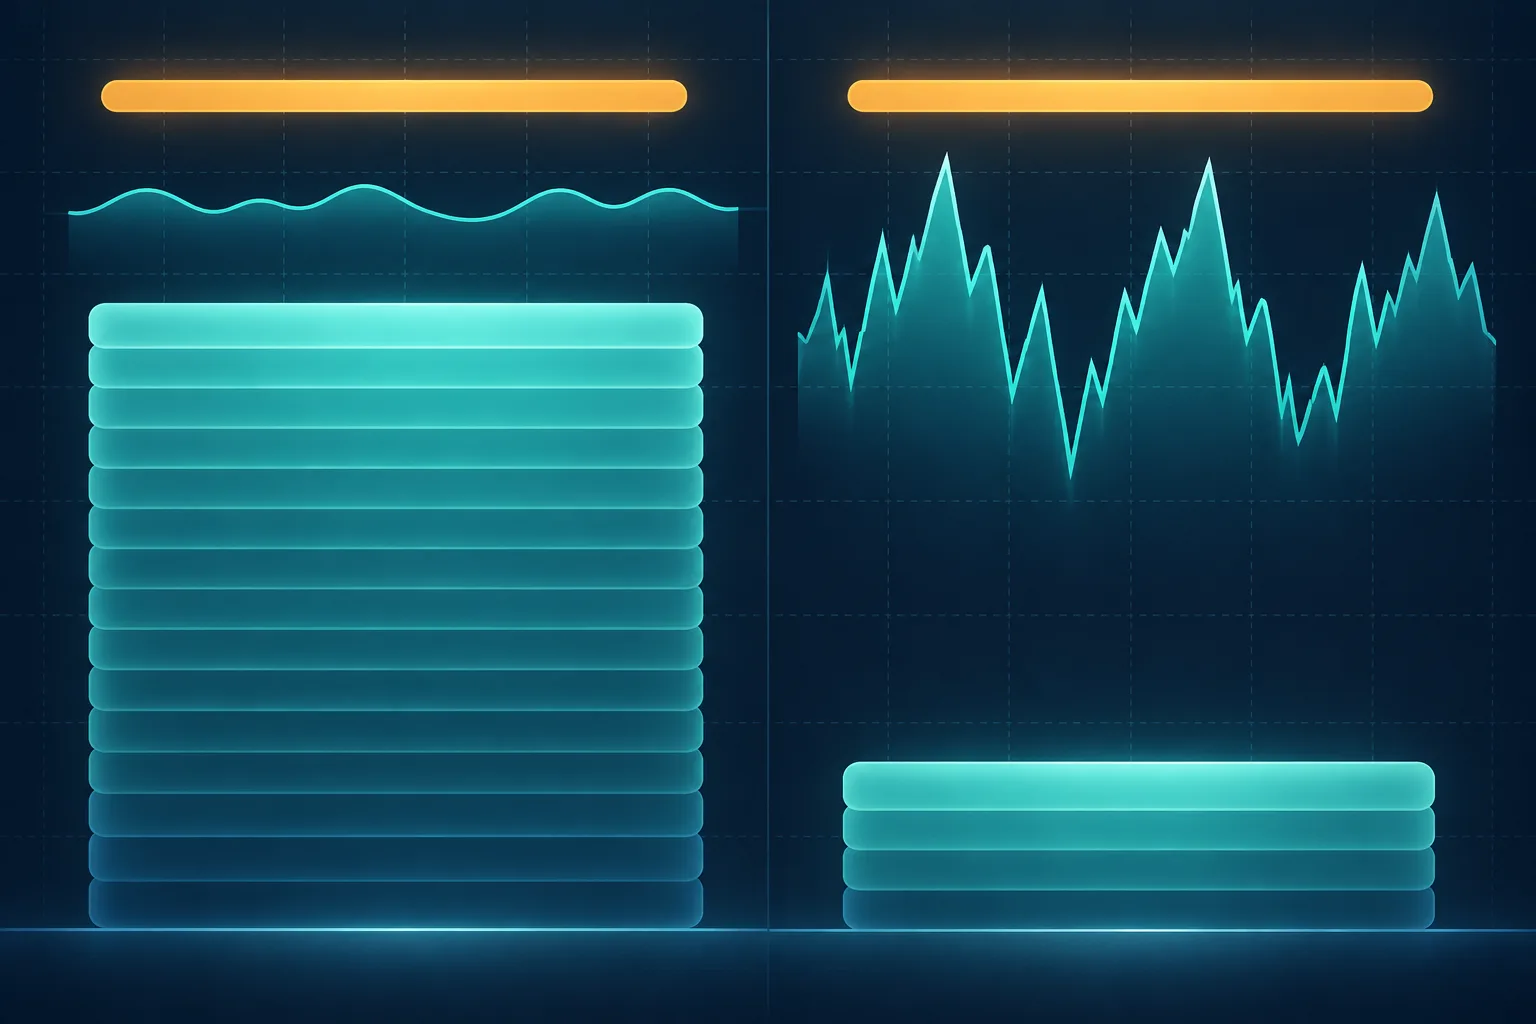
The Turtle rules use the same structure: a unit was 1% of the account divided by the dollar value of N. Sized this way, positions shrink automatically in volatile stocks and periods and grow in calm ones, so the amount a single trade can lose stays roughly constant.
Assume a $20,000 account, 1% risk per trade ($200), a 2×ATR stop, entry at the October 23, 2026 close, and whole shares rounded down. The account is hypothetical and shows the calculation only; it is not a recommendation to trade either security.
| Instrument | Close | ATR(14) | 2×ATR stop distance | Stop | Shares | Position value | Actual risk |
|---|---|---|---|---|---|---|---|
| SPDR S&P 500 ETFSPY | $759.97 | $7.22 | $14.44 (1.9%) | $745.53 | 13 | $9,879.61 | $187.72 |
| TeslaTSLA | $372.22 | $12.58 | $25.15 (6.8%) | $347.07 | 7 | $2,605.54 | $176.08 |
SPY's low volatility allows 13 shares, a position worth about half the account. Tesla's wider ATR allows 7 shares worth $2,605.54. Rounding down to whole shares leaves both trades a little under the $200 budget.
The rule matters even more when volatility shifts inside one stock. Here is Tesla with the same $20,000 account and 1% risk ($200), on its calmest and its most volatile day of the year by ATR%.
With the same $200 at risk, the calm day allows 9 shares and the volatile day only 5. The volatile-day position is worth less than half as much, $1,565.15 against $3,377.07, because its stop distance is 12.1% of the price instead of 5.9%.
A fixed share count works the other way. Buying the calm day's 9 shares on July 24, 2026 would have put $339.92 at risk to a 2×ATR stop, or 1.70% of the account instead of 1%.
To run these numbers for your own trade, the R:R calculator takes the entry, an ATR-based stop, a target, the account size and the risk percent per trade, and can round the position down to whole units. How to choose that risk percent and set daily or weekly loss limits is covered in the risk management guide.
Market Notes
ATR from regular-session daily bars leaves out several US market mechanics that change the real risk of a stop. Under the Limit Up-Limit Down plan, price bands are set as a percentage above and below a stock's average reference price over the preceding five minutes, and a stock that moves outside them can enter a trading pause; it reopens wherever trading resumes, so a triggered stop can fill well beyond its price. Stocks priced at $1 or more are quoted in minimum increments of $0.01 under SEC Rule 612, or $0.005 for some of the most tightly quoted stocks, so round a computed stop to a valid price and recompute the risk. Fractional shares, where a broker offers them, let the size follow the formula more closely, while an account that trades whole shares has to round down. Extended-hours trading, which FINRA describes as typically 7 to 9:30 a.m. ET before the open and 4 to 8 p.m. ET after the close, plus overnight sessions from 8 p.m. to 4 a.m. ET for some stocks, does not appear in regular-session bars except as the gap measured from the prior close.
Reliable vs. Risky Uses of ATR
A frequent mistake is widening the stop to 2×ATR without cutting the size. Each stopped-out trade then loses more than it did before ATR was used at all. The Tesla example above shows the scale: keeping the calm day's 9 shares on its most volatile day would have put 1.70% of the account at risk instead of 1%. An ATR stop and ATR sizing work only as a pair.
Limitations and Risks
ATR lags. It is a 14-day average, so even a True Range about 3.6 times the prior ATR, as on Tesla's July 23, 2026 bar, raised it by only about 19%. On the first day of a volatility jump, a stop set from ATR can be tighter than that day's move.
ATR does not protect against gaps. A stop placed at 2×ATR still fills near the open if the next session opens below it. FINRA and the SEC explain that a triggered stop order becomes a market order, which can fill at a price markedly different from the stop price, while a stop-limit order caps the price but may not fill at all. Actual risk can exceed planned risk, so record the planned stop and the actual fill separately.
The period and the multiple are your choices. Nothing shows that 14 days and 2× fit every instrument and every period, and tuning k again and again to past data produces a rule that fits only the past.
Different data gives different values. Whether prices are adjusted for corporate actions such as splits, whether the bars cover the regular session only, and the smoothing method all change the same day's ATR. Unadjusted prices put a false True Range on a split day, because the prior close is on the old share basis. The values in this guide come from the Alpaca daily bars used for the charts on this site, and they can differ slightly from the values on a broker's platform.
A Checklist Before Using ATR in a Trade
- Have you chosen and recorded the ATR period and smoothing method (Wilder, SMA or EMA)?
- Are you comparing instruments or periods with ATR% rather than raw ATR?
- Did you set the stop multiple k before entry, and leave it unchanged after the trade moved against you?
- Did you cut the position size as the stop widened, so the money at risk stays within your set share of the account?
- Did you round the stop to a valid price, round shares down, and recompute the actual risk?
- Could recent trading pauses, large gaps or extended-hours swings mean ATR is understating the real volatility?
- Will your journal hold the ATR at entry, k, the planned stop and the actual fill?
Frequently Asked Questions
Does ATR have to use 14 periods?
No. Fourteen is today's common platform default, not a rule. The ATR example in Wilder's book uses a 7-day version of the formula, as StockCharts quotes it, and StockCharts adds that he often used 8 periods.
A shorter period reacts faster to recent volatility but jumps on one or two big days. A longer one is steadier but slower to reflect a change. The Turtle rules used 20 days for N, and the Chandelier Exit uses 22. Whatever period you choose, record it and review your trades on the same basis.
What is the difference between ATR and Bollinger Bands?
Both measure volatility, but from different inputs.
Bollinger Bands set their width from the standard deviation of closing prices. ATR averages True Range, which is built from the high, the low and the prior close, so intraday swings and gaps feed into ATR more directly. ATR also gives a distance in price units that plugs straight into a stop or sizing calculation, while Bollinger Bands show where price sits relative to its recent average.
Key Takeaways
ATR is a ruler for how far price typically moves, and it helps only when the stop distance and the position size are both set from it.
- ATR is the average of True Range, a daily range that includes the gap from the prior close. It measures how much price moves, not which way.
- Wilder smoothing, SMA and EMA give different ATR values for the same day ($17.71 to $20.43 for Tesla on July 23, 2026), so record the period and method with every value.
- Compare instruments and periods with ATR%. On October 23, 2026, the same 5% stop was 5.26 ATR away on SPY and 1.48 ATR on Tesla.
- If the stop is k × ATR, the size is the risk budget ÷ (k × ATR). A wider stop has to come with a smaller position, or the money at risk grows.
- Trading pauses, minimum price increments, whole-share trading and extended-hours sessions can make ATR understate risk or make sizing coarse.
- ATR lags and does not stop gaps, so record the planned stop and the actual fill separately.
Logging the ATR, the multiple and the planned stop at entry, next to the actual fill at exit, in a trading journal makes it possible to check later whether the risk you planned was the risk you took.
References
- eCFR, "17 CFR 242.612 - Minimum pricing increment", retrieved October 26, 2026
- Faith, C., et al., "The Original Turtle Trading Rules", OriginalTurtles.org, 2003, retrieved October 26, 2026
- Fidelity Learning Center, "Average True Range (ATR)", Technical Indicator Guide, retrieved October 26, 2026
- FINRA, "Extended-Hours Trading: Know the Risks", retrieved October 26, 2026
- FINRA, "Investing in Fractional Shares", retrieved October 26, 2026
- FINRA, "Stop Orders: Factors to Consider During Volatile Markets", March 26, 2025, retrieved October 26, 2026
- Limit Up-Limit Down Plan, "Limit Up-Limit Down", luldplan.com, retrieved October 26, 2026
- Mandelbrot, B., "The Variation of Certain Speculative Prices", The Journal of Business 36(4), 394-419, 1963
- SEC, "Stop, Stop-Limit, and Trailing Stop Orders - Investor Bulletin", Investor.gov, retrieved October 26, 2026
- StockCharts ChartSchool, "Average True Range (ATR)" and "Chandelier Exit", retrieved October 26, 2026
- StockCharts ChartWatchers, Anderson, C., "Average True Range Comparison Shows StockCharts Is Above Average", December 3, 2011
- TA-Lib, "NATR - Normalized Average True Range", retrieved October 26, 2026
- TradingView Help Center, "Average True Range (ATR)", retrieved October 26, 2026
- Wilder, J. W., Jr., New Concepts in Technical Trading Systems, Trend Research, 1978
For reference only: The information in this post is provided for general reference and does not constitute investment advice or a solicitation to trade. Your responsibility: Final investment decisions and their outcomes are entirely your own. No warranty: This information is not guaranteed to be accurate and cannot be used as a basis for legal liability for any investment result.