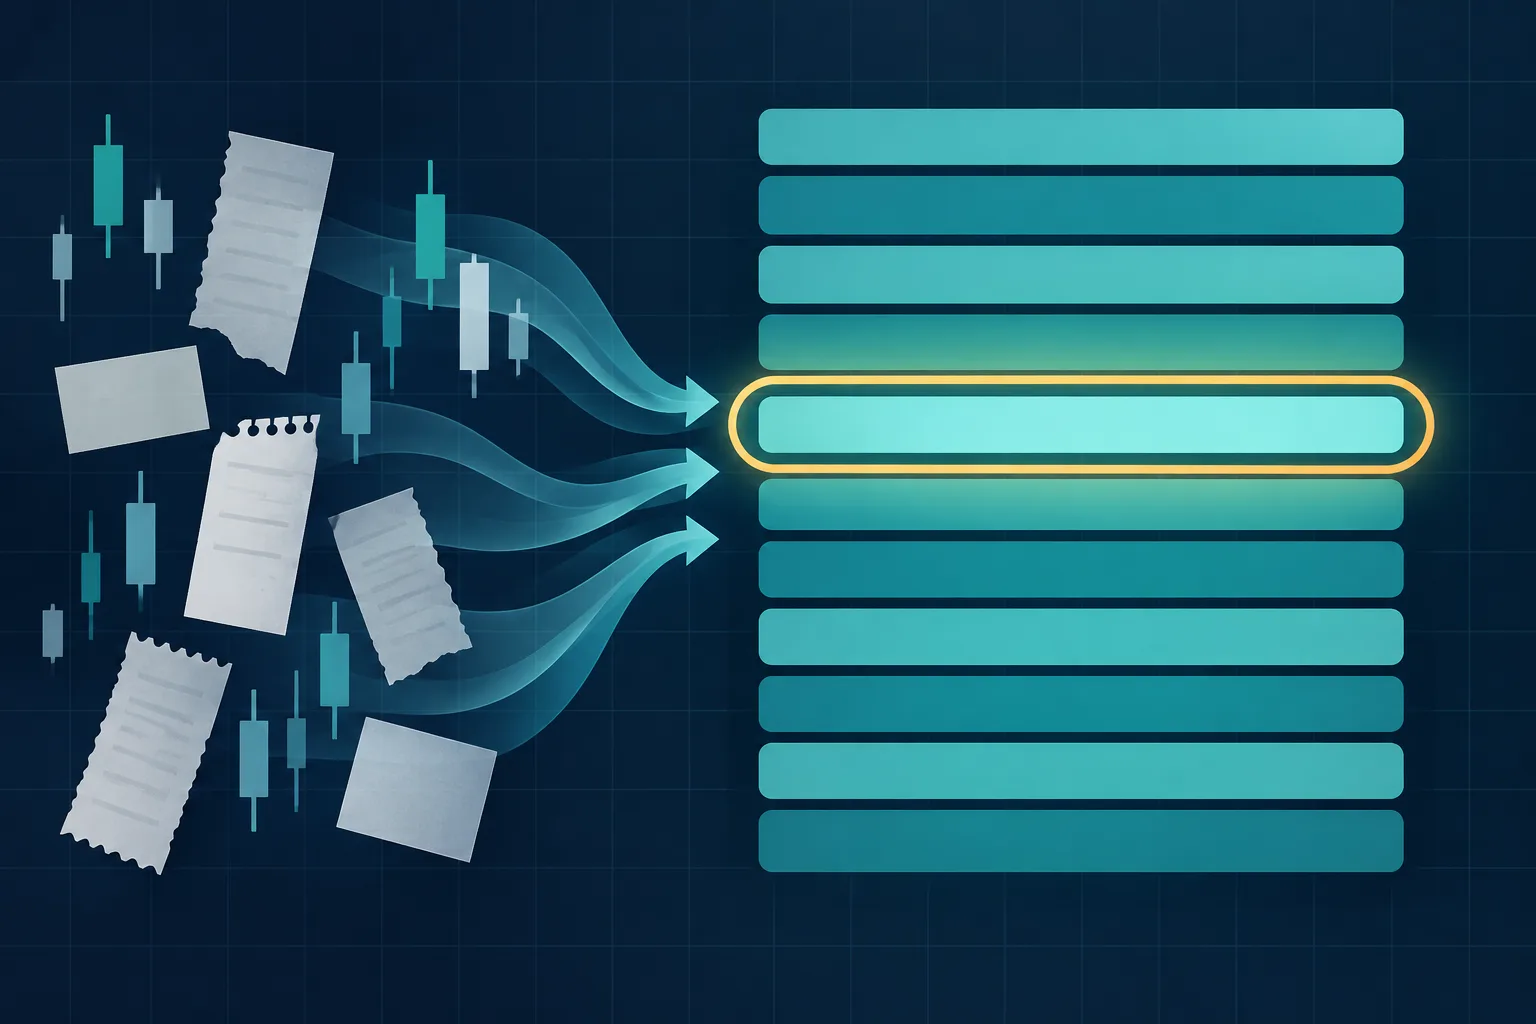
A trading journal is a dated record of each trade that pairs the trade data with the decision context. The data covers what was traded, at what price and size, and with what result. The context covers why the trade was taken, what the plan was, and how it was managed.
A journal is not a performance guarantee, and it is not a profit-and-loss spreadsheet. The research cited here documents common judgment errors and the benefit of written reflection in one training setting, but none of the studies tests trading journals directly. Journal statistics also need enough trades before they say much.
What Is a Trading Journal?
A trading journal is a written record of what a trader did and why. Each entry follows one trade from plan to review, and together the entries form a dataset the trader can sort and question.
The data layer overlaps with what brokers already supply. A FINRA investor insight explains that a trade confirmation shows the date, price, and quantity of a transaction, may show the time of execution, and discloses any commission or markup. None of these fields records why the trade was made. The journal adds that layer: the setup, the planned stop and target, the reasons for entry and exit, the trader's emotional state, and a note written after the trade closes.
Why Traders Keep a Trading Journal
Two bodies of research suggest why memory alone is an unreliable record: one documents recurring investor behavior, and the other shows that people misjudge past decisions once the outcome is known.
Disposition Effect and Overtrading
Shefrin and Statman (1985) named the disposition effect: the tendency to sell winners too early and hold losers too long. Odean (1998) measured it in trading records for 10,000 accounts at a large discount brokerage from 1987 to 1993. On days when an investor sold something, 14.8 percent of the winning positions were sold, against 9.8 percent of the losing positions, and the winners sold went on to outperform the losers kept. A 2023 study of Bitcoin transactions to exchanges, used as a proxy for selling, also found the effect, though its intensity varied over time (Schatzmann and Haslhofer, 2023).
Barber and Odean (2000) studied 66,465 households at a large discount broker from 1991 to 1996. The households that traded most earned 11.4 percent a year after costs, while the market returned 17.9 percent. The authors argue that overconfidence can explain the heavy trading and weak results. A journal makes these patterns measurable for one trader through holding times, exit reasons, trade counts, and total fees.
Hindsight, Outcome Bias, and Reflection
Fischhoff (1975) found that people who know an outcome overestimate what they would have predicted beforehand, and that they are largely unaware of doing so. Baron and Hershey (1988) reported in five studies that participants rated a decision as better thought out when its outcome was favorable, even though they had all the information the decision maker had. Participants who said outcomes should not count still rated decisions by outcome, so stating a rule does not guarantee following it.
Those studies judged other people's decisions, but a trader reviewing a personal trade is plausibly subject to the same pull. A reason written at the time of the trade preserves the reasoning before the result is known, so the review can ask whether the decision was sound separately from whether it paid.
In a Harvard Business School summary of a call-center field experiment, trainees who wrote and reflected for 15 minutes at the end of training days performed better on the final test than a control group. The setting was employee training, not trading.
What to Track in a Trading Journal
A usable entry runs from data, to decision context, to reflection. The table lists the fields in that order. A day trader may record more time-stamped fields, and a swing trader more chart context.
Record every trade, including small, losing, and rule-breaking ones. A journal that keeps only flattering trades resembles what the SEC calls cherry-picked performance, which shows only good periods or only profitable investments.
Market notes: For US stocks, record whether a fill happened in regular hours (9:30 a.m. to 4:00 p.m. Eastern) or in an extended-hours session. The SEC says extended hours generally have less trading interest, which may raise trading costs. Crypto spot pairs trade around the clock, so any daily boundary is a convention such as UTC, and the time zone belongs on every entry.
The chart below is hypothetical and illustrative. Its entry, stop, target, and exit markers are invented, and its real-symbol prices are unrelated to the hypothetical ABC entry in the examples that follow.
Trading Journal Examples: A US Stock Trade and a Crypto Trade
The two entries below are hypothetical. Tickers, prices, and fees are invented for the arithmetic, all amounts are in USD or USDT, and neither entry is a trade recommendation.
Example 1: US Stock Swing Trade
The numbers describe a winning trade. The context shows a plan deviation: the trade returned about 1.2R where the plan offered 2R. One trade proves little, but the same note recurring across 20 trades would be a measurable habit.
Example 2: Crypto Spot Trade
The loss is modest, but the entry shows a process gap: with no stop, the result had no plan to be measured against. The emotion points to the pattern in the FOMO trading guide, and the missing stop is a trading plan and risk management question.
Spreadsheet or App: Choosing a Format
Both formats work when entries are complete and consistent. They differ in who maintains the calculations, the charts, and the data entry.
The free trading journal template for Google Sheets and Excel is a starting point for the spreadsheet route, and trading journal apps compared gives a neutral overview of the app route. Trading Journl is one example of an app: it records entries and exits with chart markers, calculates win rate, profit factor, and a P&L calendar from saved trades, and its currently available features are free.
How to Start a Trading Journal
Three related records are easy to blur. The CME Group lesson Step 5. Keep a Trade Log asks traders to record why each trade was made, with price targets and entry and exit points, and to write daily conclusions in a trading journal. The lesson uses both terms, so the distinction below is the one this guide applies.
- Choose a format, a spreadsheet or an app, and keep it so that entries stay comparable.
- Fix the field list from the table above. A shorter list that is always completed beats a longer list that is not.
- Record at the time of the trade: the plan and entry reason at entry, and the exit reason at exit.
- Schedule the weekly review as a recurring appointment, not as a task for spare time.
- Set a minimum sample before drawing conclusions. Choose the number in advance and treat earlier results as provisional.
How to Run a Weekly Trade Review
A weekly review turns entries into rules. The sequence below keeps attention on the decision before the result.
- Complete the week's entries. Fill any missing reason, emotion, or exit note while the trades are fresh.
- Total the week: trade count, net P&L after fees, win rate, and average win against average loss.
- Judge each decision before looking at its result. Mark the plan as followed or broken using only what was known at entry.
- Look for repeats by setup, emotion, time of day, and holding period, including the holding time of winners against losers.
- Write one rule for the coming week that can be answered with yes or no, such as: the stop is written before the order is placed.
- Open the next review by checking that rule first.

Metrics a Trading Journal Makes Possible
Complete entries make the standard performance metrics available. Each metric summarizes the journal, so each inherits its gaps.
- Win rate:
winning trades ÷ closed trades. It shows how often trades finish net positive, not how much they earn. See the guide to win rate. - Profit factor:
gross profit ÷ gross loss. A value above 1.0 means profits exceeded losses over the sample. See the guide to profit factor. - Net P&L: realized profit or loss after fees. See what P&L means.
- R-multiple:
net result ÷ initial risk, where initial risk is the planned entry-to-stop distance times position size, so a recorded stop is required. The concept follows Tharp (2006). See the risk-reward ratio guide and the risk/reward calculator. - Expectancy: the average result per trade, in currency or in R. In R terms it is the mean R-multiple (Tharp, 2006).
- Payoff ratio:
average win ÷ average loss. The win rate guide covers how expectancy and payoff ratio complete the picture.
Limitations and Risks
- Sample size. A win rate measured on few trades is imprecise. Ten wins in 20 trades gives a 95 percent Wilson interval of roughly 30 to 70 percent, and 50 wins in 100 trades narrows it to roughly 40 to 60 percent (calculated for this guide). Brown, Cai, and DasGupta (2001) recommend the Wilson or Jeffreys interval for small samples and the Agresti-Coull interval for larger ones. This guide applies the Wilson formula at both sizes.
- Evidence base. The cited studies concern investor behavior, judgment, and workplace learning. None shows that keeping a trading journal improves trading results, and stating a rule does not guarantee following it: in Baron and Hershey's studies, participants who said outcomes should not count still rated decisions by outcome.
- Past results. The SEC notes that past performance cannot predict how a strategy will perform in the future, and a record covering one market condition says little about others.
- Risk control. A journal records decisions but does not enforce limits. Position sizing and loss limits belong to trading risk management.
- Upkeep. A template heavier than the trader will sustain produces gaps, and gaps distort every statistic.
A Checklist Before Relying on a Trading Journal
- Does each entry include the date, time zone, symbol, direction, quantity, prices, and fees?
- Was the reason for entry written at or before the time of the trade?
- Is the planned stop recorded, so that R can be calculated?
- Does each entry say whether the plan was followed, separately from the result?
- Are small, losing, and rule-breaking trades recorded as well as the good ones?
- Is a weekly review scheduled, with last week's rule checked first?
- Is the number of trades shown next to every metric?
Frequently Asked Questions
How often should you review a trading journal?
Record each trade on the day it closes. Beyond the weekly pass described above, check aggregate metrics monthly or after a block of trades. The schedule is a convention, not one tested in research.
Is a trading journal the same as a trading plan?
No. A trading plan states the rules before trades are taken, and a journal records afterward what happened and why. The plan is the standard the journal is reviewed against. The guide to the trading plan covers writing the rules.
Can one trading journal cover US stocks and crypto?
Yes, if every entry carries a market field and each market is reviewed separately. A blended win rate can hide differences in fees and price behavior between US stocks and crypto.
Key Takeaways
A trading journal turns each trade into a record that can be reviewed later, provided it holds the reasoning as well as the numbers.
- A trading journal pairs trade data with decision context, the layer that broker confirmations do not record.
- Research on the disposition effect, overtrading, hindsight, and outcome bias documents common errors that a written record can expose.
- A usable entry holds the executions, fees, a planned stop, the reasons for entry and exit, the emotional state, and one next rule.
- A weekly review that judges the decision before the result turns entries into checkable rules.
- Win rate, profit factor, expectancy, and R need enough trades: 10 wins in 20 trades has a 95 percent interval of roughly 30 to 70 percent.
- Nothing cited here shows that journaling improves results, and it does not replace risk limits.
Whatever format is used, writing the reason for each decision at the time it is made gives the later review something that memory cannot supply.
References
- Odean, T., "Are Investors Reluctant to Realize Their Losses?" The Journal of Finance 53(5), 1775–1798, 1998. doi:10.1111/0022-1082.00072
- Barber, B. M., and Odean, T., "Trading Is Hazardous to Your Wealth: The Common Stock Investment Performance of Individual Investors," The Journal of Finance 55(2), 773–806, 2000. doi:10.1111/0022-1082.00226
- Shefrin, H., and Statman, M., "The Disposition to Sell Winners Too Early and Ride Losers Too Long: Theory and Evidence," The Journal of Finance 40(3), 777–790, 1985. doi:10.1111/j.1540-6261.1985.tb05002.x
- Schatzmann, J. E., and Haslhofer, B., "Exploring Investor Behavior in Bitcoin: A Study of the Disposition Effect," Digital Finance 5(3–4), 581–612, 2023. doi:10.1007/s42521-023-00086-w
- Fischhoff, B., "Hindsight Is Not Equal to Foresight: The Effect of Outcome Knowledge on Judgment Under Uncertainty," Journal of Experimental Psychology: Human Perception and Performance 1(3), 288–299, 1975. doi:10.1037/0096-1523.1.3.288
- Baron, J., and Hershey, J. C., "Outcome Bias in Decision Evaluation," Journal of Personality and Social Psychology 54(4), 569–579, 1988. doi:10.1037/0022-3514.54.4.569
- Di Stefano, G., Gino, F., Pisano, G., and Staats, B., working paper "Learning by Thinking: How Reflection Aids Performance," later titled "Making Experience Count: The Role of Reflection in Individual Learning," as summarized in Harvard Business School Working Knowledge, "Reflecting on Work Improves Job Performance," May 5, 2014. library.hbs.edu
- Brown, L. D., Cai, T. T., and DasGupta, A., "Interval Estimation for a Binomial Proportion," Statistical Science 16(2), 2001. doi:10.1214/ss/1009213286
- FINRA, "Are You Checking Your Trade Confirmations?" November 21, 2024. finra.org
- CME Group Education, "Step 5. Keep a Trade Log," in the Building a Trade Plan course. cmegroup.com. Read from an Internet Archive snapshot of the official page dated December 14, 2025, on October 1, 2026.
- SEC Office of Investor Education and Advocacy, "Investor Bulletin: Performance Claims," September 15, 2022. Investor.gov
- SEC Office of Investor Education and Advocacy, "Extended-Hours Trading: Investor Bulletin," June 6, 2022. Investor.gov
- Tharp, V. K., Trade Your Way to Financial Freedom, 2nd ed., McGraw-Hill, 2006. Cited for the R-multiple and expectancy concepts only.
For reference only: The information in this post is provided for general reference and does not constitute investment advice or a solicitation to trade. Your responsibility: Final investment decisions and their outcomes are entirely your own. No warranty: This information is not guaranteed to be accurate and cannot be used as a basis for legal liability for any investment result.