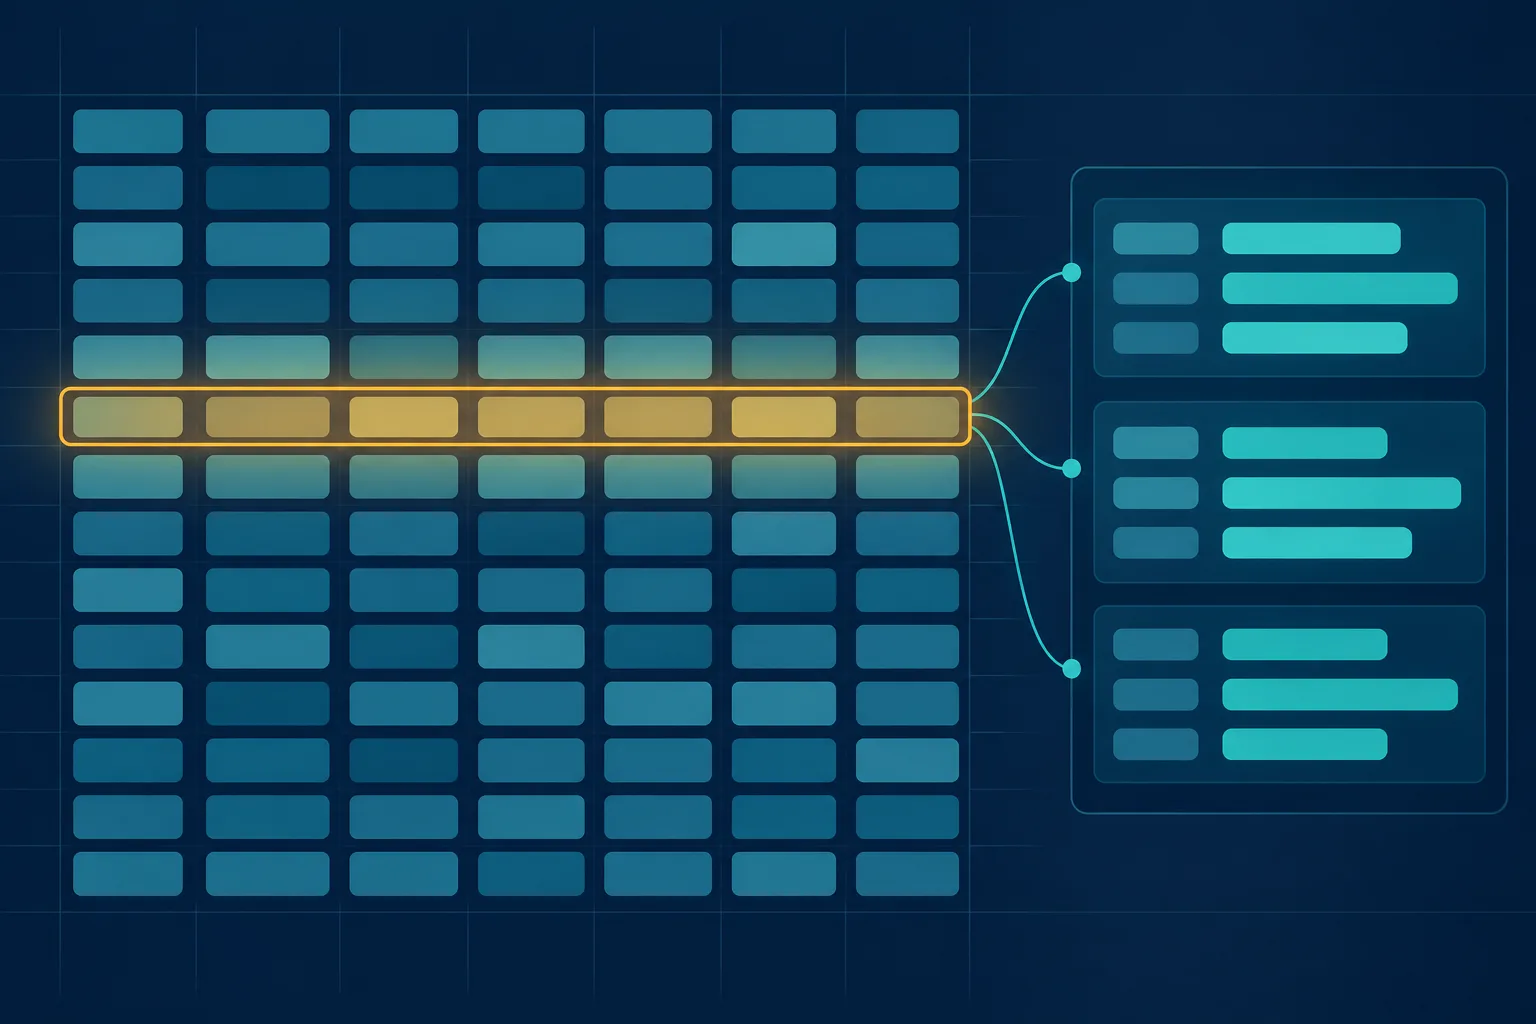
A trading journal template is a ready-made set of columns that records every trade in the same structure. The free template on this page is a CSV file with 14 columns and three hypothetical sample rows that opens in Google Sheets and Excel. Download the trading journal template (CSV), then add the formulas for net P&L, win rate, profit factor, and average R that this guide provides.
A template stores records and does not improve results by itself, and its statistics are only as reliable as the entries and the trade count behind them. The three sample rows are illustrative, not real trades or recommendations.
What Is a Trading Journal Template?
A trading journal template fixes the fields of each journal entry: each row is one trade and each column is one field. It is sometimes called a trade log or a trading log spreadsheet. The guide to what a trading journal is covers the research behind it.
The first ten columns hold facts that a broker or exchange supplies. A FINRA investor insight explains that a trade confirmation shows the date, price, and quantity of a transaction, may show the time of execution, and discloses a commission or markup where one applies. None of these records why the trade was taken, so the last four columns add the decision context and a reflection note.
The download is a CSV file, a text format in which each record is on its own line, fields are separated by commas, and the first line may be a header (RFC 4180). This file contains a header row and three sample rows: AAPL long, NVDA short, and BTCUSDT long. The sample rows are hypothetical and illustrative, not records of real trades. The file contains no formulas, so they are added after it is opened.
A row holds the entry and exit prices but not the path between them. The chart below is illustrative, its trade is hypothetical and not a recommendation, and its prices are unrelated to the sample rows.
How to Open the Template in Google Sheets and Excel
Save the file from the trading journal template download. The steps follow Google's and Microsoft's help pages on importing text files. To use it as a Google Sheets trading journal:
- Open a new blank spreadsheet in Google Sheets.
- Choose File, then Import, and select the downloaded file.
- Choose Replace spreadsheet as the import option, leave the separator character on Detect automatically or choose Comma, and confirm the import.
To use it in Excel:
- Choose File, then Open, and browse to the downloaded file. If the CSV is not listed, set the file-type dropdown to text files. Data, then From Text/CSV, gives more control over column formats.
- Choose File, then Save As, and save a working copy as an Excel Workbook (.xlsx). Microsoft Support notes that saving to a text format keeps only the current worksheet and that features unsupported by text formats may be lost.
In both apps, check that numbers are not imported as text: dates, prices, quantity, and fees should be right-aligned. Left-aligned numbers are read as text, and the formulas below fail on them. Microsoft Support notes that Excel reads a .csv with its default data format settings, so dates can be interpreted differently from how they were written. Keep the sample rows until the formulas are checked, then overwrite them.
What Each Column Records
The 14 columns fall into three groups: ten data, two decision, and two reflection columns. Dates use YYYY-MM-DD and times use HH:MM, as in the sample rows.

Market notes: Crypto spot pairs such as BTCUSDT trade around the clock with no official daily close, and the time columns hold no time zone, so choose one zone for every row. This guide treats 1 USDT as 1 USD, and a sheet that mixes quote currencies needs a currency column.
How to Add the Formulas
Add the formulas to the right of the Improvements column, so the 14 original columns stay in place. They work in both Google Sheets and Excel under these assumptions:
- Headers are in row 1, trades start in row 2, and every range ends at row 500.
- The columns keep the file's order, so Direction is B, Entry Price is E, Exit Date is F, Exit Price is H, Quantity is I, and Fees is J.
- Direction reads exactly Long or Short, and prices, quantity, and fees are numbers.
- Each row is one closed trade from flat to flat, with one total fee in the price currency.
- Quantity multiplies the price difference directly, as with shares and spot coins. Contracts with a multiplier need an extra column.
- A trade with a net result above zero is a win. Arguments are separated by commas and decimals use a period.
Net P&L per Trade
For a long trade, net P&L is (Exit Price − Entry Price) × Quantity − Fees. For a short trade, it is (Entry Price − Exit Price) × Quantity − Fees. What P&L means in trading covers gross and net results. Under a new header, Net P&L, in column O, enter this formula in cell O2 and copy it down to row 500:
=IF(H2="","",IF(B2="Long",(H2-E2)*I2-J2,IF(B2="Short",(E2-H2)*I2-J2,"")))
The first IF leaves an open trade blank, because an empty Exit Price would otherwise be read as zero. The next two IFs apply the long and short arithmetic, and a Direction value that is neither returns a blank, which makes the typo visible. The three sample rows should return 328, 167.5, and 16.0825.
Win Rate, Gross Profit, Gross Loss, and Profit Factor
Place these formulas outside the data columns, so that no formula sits inside the range it reads.
Break-even trades stay in the denominator of the win rate but not in the numerator, the counting rule used in the win rate guide. The profit factor guide explains how to read the ratio.
Average R With a Stop Column
R is the initial risk of a trade, set by the planned stop, and an R-multiple is the result divided by that initial risk (Tharp, 2006). Add three columns after Net P&L: Stop Price, entered before the trade, then the Risk and R-multiple formulas.
- Risk, in cell Q2:
=IF(P2="","",ABS(E2-P2)*I2) - R-multiple, in cell R2:
=IFERROR(O2/Q2,"") - Average R:
=IFERROR(AVERAGE(R2:R500),"n/a") - Trades counted in the average:
=COUNT(R2:R500)
Trades without a stop are excluded from average R, so show the count beside it. Risk is the distance from entry to stop times quantity, so one formula covers long and short trades, and the IF keeps an empty stop from being read as zero. Fees are subtracted in the result but not in the risk, so a trade closed exactly at its stop can read slightly below −1R. The risk-reward ratio guide and the risk/reward calculator cover planning the stop and the target.
A Filled Example: Eight Hypothetical Trades
The first three rows are the template's sample rows. The other five rows and every stop price are hypothetical, USDT results are treated as USD, and no trade is a recommendation.
The summary formulas return these figures for the eight rows.
Half of the trades finished in profit, yet the profit factor is 1.74, because the average win of 147.72 is larger than the average loss of 85.10. The BTCUSDT trade earned the least of the four winners, 16.08 USDT, yet its 1.43R is lower than, but of similar size to, the other three winners, because only 11.26 USDT was at risk. The MSFT trade closed at its stop and reads −1.02R because of fees.
These figures rest on eight trades. Each trade moves the win rate by 12.5 percentage points, and the 95% Wilson interval around the 50% win rate runs from about 22% to 78%. That interval is a calculation, not market data, and the Wilson method is described in the NIST e-Handbook. The win rate guide shows how it narrows from 20 to 500 trades.
How to Run a Weekly Review With the Template
A weekly review turns the rows into rules. This sequence adapts the routine in the guide to what a trading journal is.
- Complete the week's rows. Fill any empty Entry Reason, Exit Reason, and Emotions cells while the trades are fresh.
- Check the data. Every closed row should show a Net P&L. A row with prices but a blank P&L has a Direction typo or a missing exit price.
- Total the week by exit date, using the formulas below this list.
- Judge each decision before looking at its result, using only what was known at entry.
- Look for repeats. With a fixed list of emotion labels,
=AVERAGEIF(M2:M500,"Calm",O2:O500)returns the average Net P&L of the trades labeled Calm. With few trades per label, treat the result as a question, not a conclusion. - Write one rule for the coming week that can be answered with yes or no, and check it first at the next review.
Enter the first and last dates of the week in two cells, here U10 and U11, and use these weekly formulas:
- Closed trades:
=COUNTIFS(F2:F500,">="&U10,F2:F500,"<="&U11) - Winning trades:
=COUNTIFS(F2:F500,">="&U10,F2:F500,"<="&U11,O2:O500,">0") - Net P&L:
=SUMIFS(O2:O500,F2:F500,">="&U10,F2:F500,"<="&U11)
A trade belongs to the week in which it closed, and Exit Date must hold real dates, not text. COUNTIF and SUMIF count every row in the range, including rows hidden by a filter, so filtering the sheet to one week does not change the summary figures above. The date-bounded formulas do.
When a Spreadsheet Stops Being Enough
A spreadsheet stays adequate while trade volume is low and the formulas are checked. Three limits tend to appear first.
- Manual upkeep. Every trade needs 14 fields typed or pasted and fees looked up. A missed field stays missed unless the trader adds checks, and gaps distort every statistic.
- Error-prone formulas. Panko reports that since 1995, 88% of the 113 spreadsheets audited in seven studies that reported the number audited contained errors. He also reports that spreadsheets, even after careful development, contain errors in one percent or more of all formula cells (Panko, 1998, revised 2008). Those audits examined spreadsheets from organizations, and a journal sheet is far smaller, so the rate does not transfer directly. The lesson is to check every formula against a hand calculation.
- No chart context. The row holds two prices, while the chart that shows the path between them sits in a separate folder, if it was saved at all.
Trading Journl can import this CSV after choosing the market, US stocks or crypto, and mapping the columns once. The file mixes markets, so import each market's rows separately and delete the hypothetical sample rows first.
Limitations and Risks
- Formulas read only what is typed. A Direction value with a trailing space, fees in another currency, or a price stored as text produces a blank or wrong figure with no warning. A drop-down list on the Direction column prevents the first problem.
- Closed trades only. The formulas ignore open trades, so no unrealized loss appears in the win rate or profit factor.
- Past results. The SEC states that past performance cannot predict how an investment strategy will perform in the future. It also describes cherry-picked performance as showing only good periods or only profitable investments, so every trade belongs in the sheet, losers included.
A Checklist Before Relying on the Template's Numbers
- Did the Net P&L formula reproduce 328, 167.5, and 16.0825 on the three sample rows before they were replaced?
- Does every Direction cell read exactly Long or Short?
- Are the prices, quantity, and fees right-aligned numbers and not text?
- Are fees the total for the whole trade, in the same currency as the prices?
- Do the summary ranges reach every row that holds a trade?
- Is the trade count shown beside the win rate and the profit factor, since a few trades make both imprecise?
- Was each entry reason written at or before the entry?
Frequently Asked Questions
How do I record a trade with several entries or exits in the template?
Use one row for each trade from flat to flat, with the total quantity and the combined fees. For the entry, the average price calculator shows the new average price after an added purchase. For the exit, add up price times quantity for every exit and divide by the total quantity. Counting each partial exit as its own row changes the trade count and the win rate.
Key Takeaways
The template is a CSV with 14 columns that becomes a working journal once the formulas are added and checked.
- The file holds a header row and three hypothetical sample rows, with no formulas. Its columns group into ten data, two decision, and two reflection columns.
- Net P&L uses IF on Direction: long is (Exit − Entry) × Quantity − Fees, and short is (Entry − Exit) × Quantity − Fees.
- Win rate uses COUNTIF, profit factor divides the SUMIF of positive results by the absolute SUMIF of negative results, and average R needs a planned stop column.
- In the eight-trade example, the win rate is 50% and the profit factor is 1.74, but the 95% interval around the win rate runs from about 22% to 78%.
- Field audits found errors in 88% of 113 spreadsheets, so each formula needs a hand check, and COUNTIF and SUMIF ignore filters.
Whatever tool holds the rows, recording the reason and the planned stop at the time of each decision gives the weekly review something to check against later.
References
- Shafranovich, Y., "Common Format and MIME Type for Comma-Separated Values (CSV) Files," RFC 4180, Internet Engineering Task Force, October 2005. rfc-editor.org
- Panko, R. R., "What We Know About Spreadsheet Errors," Journal of End User Computing 10(2), 15–21, Spring 1998, revised May 2008 (archived copy). web.archive.org
- FINRA, "Are You Checking Your Trade Confirmations?" November 21, 2024. finra.org
- SEC Office of Investor Education and Advocacy, "Investor Bulletin: Performance Claims," September 15, 2022. Investor.gov
- Tharp, V. K., Trade Your Way to Financial Freedom, McGraw-Hill, 2006 (concept of the R-multiple only).
- Google, Google Docs Editors Help, "Import data sets & spreadsheets," retrieved October 2, 2026. Cited for the Google Sheets steps only. support.google.com
- Microsoft, Microsoft Support, "Import or export text (.txt or .csv) files," retrieved October 2, 2026. Cited for the Excel steps only. support.microsoft.com
- NIST/SEMATECH, e-Handbook of Statistical Methods, section 7.2.4.1, "Confidence intervals," retrieved October 2, 2026. itl.nist.gov
For reference only: The information in this post is provided for general reference and does not constitute investment advice or a solicitation to trade. Your responsibility: Final investment decisions and their outcomes are entirely your own. No warranty: This information is not guaranteed to be accurate and cannot be used as a basis for legal liability for any investment result.