
A software sell-off pulled all three major US indexes lower on Tuesday, Nov 17 (ET). The Dow Jones Industrial Average fell 1.64% to 50,759.42, the S&P 500 lost 1.03% to 7,340.53 and the Nasdaq Composite slipped 0.74% to 24,328.38. Salesforce dropped 9.45%, the steepest fall among S&P 500 members, and Nvidia reported third-quarter results above expectations after the close.
Key takeaways
- The Dow fell 848.75 points (1.64%), the S&P 500 lost 76.06 points (1.03%) and the Russell 2000 dropped 1.50%.
- Large software names fell together: Salesforce down 9.45%, Intuit down 7.17%, ServiceNow down 6.51% and Workday down 5.80%.
- Nvidia closed the regular session down 0.44% at $155.46, then reported revenue of $115.8 billion (up 103% from a year earlier) and guided to $130.0 billion, plus or minus 3%, for the fourth quarter.
- All 11 S&P 500 sector ETFs fell; financials (XLF) lost the most at 1.91%.
- The VIX rose 11.13% to 25.46 and the US 10-year Treasury yield ended at 5.10%.
Index closes
Losses reached well beyond software. RiskReversal noted that the equal-weight S&P 500 ETF (RSP) fell 1.4%, more than the cap-weighted index, and that 85% of names finished lower.
Sectors: all 11 sector ETFs fell
Every one of the 11 Select Sector SPDR ETFs closed lower. Energy (XLE, down 0.52%) and industrials (XLI, down 0.55%) held up best. Financials (XLF) fell 1.91%, utilities (XLU) 1.59% and real estate (XLRE) 1.49%. Technology (XLK) lost 0.91%; RiskReversal said the semiconductor ETF (SMH) rallied late and finished roughly flat.
Software was hit much harder than the tech sector as a whole: RiskReversal put the iShares software ETF (IGV) down 3.2%. For financials, RiskReversal pointed to security concerns. Yahoo Finance reported a brief website loading problem at Charles Schwab that was resolved, with trading available throughout.
Software sell-off: Salesforce, Intuit, ServiceNow and Workday
Software stocks led the day's decline, and coverage offered two explanations: worry that AI agents will shrink the per-seat licenses many software companies charge for, and selling by funds raising cash ahead of Anthropic's initial public offering, which was set to price the next day. Benzinga reported that Anthropic plans to sell 825 million shares at $70 to $78 each, raising up to $64.4 billion.

Salesforce down 9.45%
Salesforce closed at $194.52, down 9.45% from $214.83 the day before. MLQ.ai, citing Investing.com, said doubts about how quickly Agentforce, its AI agent product, will add revenue and concern about its $5.7 billion Braze deal were also in play. The same report, citing Yahoo Finance, said Salesforce's Anthropic stake made up about 45% of its $11.3 billion strategic investment portfolio as of July 31.
Chart data
Chart summary: Salesforce (CRM) daily candles, 2026-07-20 to 2026-11-17. Close 173.79 USD → 194.52 USD (+11.9%); period high 268.27 (2026-09-03), low 155.15 (2026-07-23). Marked: Software selloff 2026-11-17 close 194.52.
On the chart, the $194.52 close sits below both the 20-day moving average (about $226.70) and the 60-day average (about $235.49), and about 26% under the Sept. 3 closing high of $264.43. Volume was roughly twice the average of the previous 20 sessions.
Intuit down 7.17%
Intuit closed at $320.79, down 7.17%, a day after gaining 1.13%. No company announcement was reported; the stock fell with the rest of the software group.
Chart data
Chart summary: Intuit (INTU) daily candles, 2026-07-20 to 2026-11-17. Close 293.82 USD → 320.79 USD (+9.2%); period high 372.98 (2026-08-24), low 262.32 (2026-09-28). Marked: Software selloff 2026-11-17 close 320.79.
The chart shows the $320.79 close below the 20-day moving average (about $341.10) and just under the 60-day average (about $322.52). Since July 20, closes have ranged from $268.03 on Sept. 29 to $369.92 on Aug. 24.
ServiceNow down 6.51%
ServiceNow closed at $92.90, down 6.51%. MLQ.ai said there was no company news that day. According to the same report, the stock's weakness dates to Oct. 28, when its fourth-quarter guidance for 18.5% constant-currency growth in cRPO (current remaining performance obligations) missed the roughly 19.8% analysts expected.
Chart data
Chart summary: ServiceNow (NOW) daily candles, 2026-07-20 to 2026-11-17. Close 104.70 USD → 92.90 USD (-11.3%); period high 159.50 (2026-10-23), low 91.53 (2026-07-23). Marked: Software selloff 2026-11-17 close 92.90.
On the chart, ServiceNow's close has fallen about 42% from $158.96 on Oct. 23 to $92.90. The Nov. 17 close sits well below the 20-day moving average (about $118.78) and the 60-day average (about $131.77), and close to the July 23 closing low of $91.94.
Workday down 5.80%
Workday closed at $182.80, down 5.80%. No company-specific reason was reported. Workday reports earnings on Nov. 24.
Chart data
Chart summary: Workday (WDAY) daily candles, 2026-07-20 to 2026-11-17. Close 147.22 USD → 182.80 USD (+24.2%); period high 227.49 (2026-08-13), low 127.11 (2026-07-23). Marked: Software selloff 2026-11-17 close 182.80.
The $182.80 close is below both the 20-day moving average (about $197.99) and the 60-day average (about $193.82), and about 13% under the $209.99 closing high set on Oct. 22 and 23. It is still about 24% above the July 20 close of $147.22.
Notable stocks
| Stock | Close ($) | Change | Note |
|---|---|---|---|
| SalesforceCRM | 194.52 | -9.45% | Led the software sell-off |
| IntuitINTU | 320.79 | -7.17% | No company news |
| ServiceNowNOW | 92.90 | -6.51% | No company news |
| WorkdayWDAY | 182.80 | -5.80% | Reports Nov. 24 |
| DatadogDDOG | 165.18 | -4.44% | Fell with software |
| MicrosoftMSFT | 506.24 | -2.27% | Large-cap tech weakness |
| Home DepotHD | 339.01 | -2.45% | Earnings, new CEO named |
| DisneyDIS | 116.94 | -1.48% | Fiscal Q4 earnings |
| NvidiaNVDA | 155.46 | -0.44% | Q3 results after the close |


Nvidia third quarter: $115.8 billion in revenue
After the close, Nvidia reported results for the third quarter of fiscal 2027, which ended Oct. 25. According to the company's release, revenue was $115.8 billion, up 20% from the prior quarter and 103% from a year earlier. Data center revenue was $107.6 billion, up 110% from a year earlier. Non-GAAP earnings per share were $2.68 and non-GAAP gross margin was 74.9%.
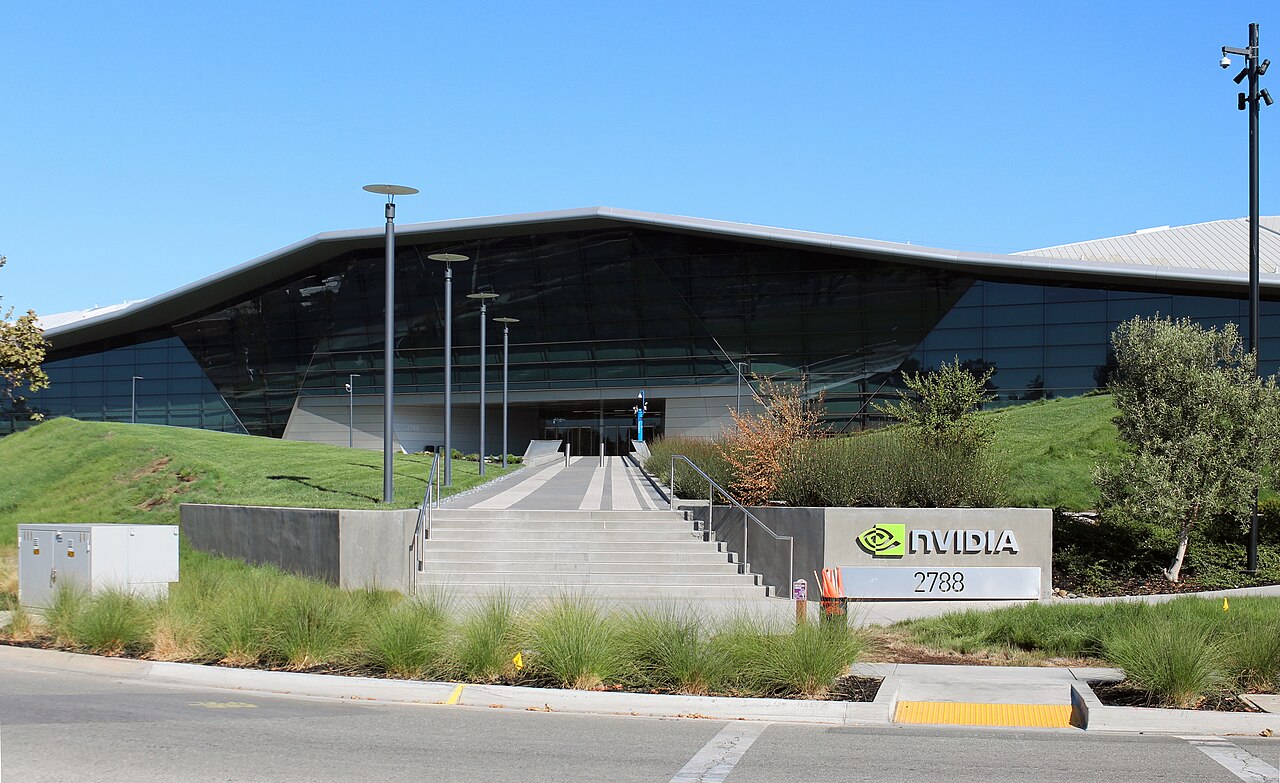
The company guided to fourth-quarter revenue of $130.0 billion, plus or minus 3%, assuming no data center compute revenue from China. The board raised the share repurchase authorization by $150 billion, leaving about $227.3 billion available at the end of the quarter. NBC News said analysts had expected revenue of $109.33 billion and fourth-quarter guidance of $125.25 billion.
This was Nvidia's first report since Jensen Huang stepped down as CEO; CFO Colette Kress is serving as interim CEO. NBC News reported that board chair Harvey Jones said the board does not intend to reinstate Huang. The stock closed the regular session down 0.44% at $155.46, and NBC News said it rose as much as 4% in after-hours trading. We covered Nvidia's recent moves in the Nov. 12 market close and the Nov. 16 market close.
Rates, volatility, commodities and data
The 10-year Treasury yield fell 0.02 percentage point to 5.10%. The VIX rose 11.13% to 25.46. Per Yahoo Finance, December WTI crude slipped 0.13% to $85.61 a barrel and gold eased 0.03% to $3,851.90 an ounce.
October retail sales rose 0.2% from September, ahead of the 0.1% forecast. Excluding autos and gas, sales rose 0.5%, and September was revised up to 0.8%. Homebuilder sentiment fell four points to 25 in November, the lowest reading since April 2012, against an expected 29.
On the Fed side, Yahoo Finance reported that St. Louis Fed President Alberto Musalem said rate hikes are needed soon, with more before spring 2027.
Other company news
- Home Depot beat third-quarter estimates and named CFO Richard McPhail as CEO, effective Nov. 23. The stock fell 2.45%.
- Disney reported fiscal fourth-quarter adjusted EPS of $1.77, above the $1.68 estimate. The stock fell 1.48%.
- JPMorgan said CFO Jeremy Barnum will step down next year, to be succeeded by Bregje de Best.
- Yahoo Finance reported that optical stocks including Lumentum and Corning gave back gains after reports of new US restrictions on Chinese data center equipment.
What to watch next
- Wed, Nov. 18: Anthropic IPO expected to price (per Benzinga)
- Thu, Nov. 19: Anthropic expected to start trading on Nasdaq under "ANT" (per Benzinga)
- Tue, Nov. 24: Workday earnings
- Wed, Dec. 2: Salesforce earnings; record date for Nvidia's quarterly dividend
- Wed, Dec. 23: Nvidia pays its $0.25 quarterly dividend
FAQ
How much did US stocks fall on Nov 17, 2026?
On Tuesday, Nov 17 (ET), the Dow fell 848.75 points (1.64%) to 50,759.42, the S&P 500 lost 1.03% to 7,340.53 and the Nasdaq Composite slipped 0.74% to 24,328.38. The Russell 2000 dropped 1.50%.
Why did Salesforce stock fall?
Salesforce closed down 9.45% at $194.52. Coverage of the software sell-off cited worry that AI agents will erode per-seat software pricing and selling to raise cash ahead of Anthropic's IPO. Doubts about how fast Agentforce adds revenue and concern about the Braze deal were also mentioned.
What did Nvidia report for the third quarter of fiscal 2027?
Nvidia reported revenue of $115.8 billion, up 103% from a year earlier, with data center revenue of $107.6 billion. Non-GAAP EPS was $2.68, and fourth-quarter revenue guidance is $130.0 billion, plus or minus 3%. The stock fell 0.44% in the regular session and rose after hours.
Which sector held up best on Nov 17?
All 11 S&P 500 sector ETFs fell. Energy (XLE) had the smallest loss at 0.52%, followed by industrials (XLI) at 0.55%. Financials (XLF) had the largest loss at 1.91%.
Sources
- Yahoo Finance: Stock market today, Tuesday Nov 17
- NVIDIA Form 8-K: Financial results for third quarter fiscal 2027
- NBC News: Nvidia earnings live updates
- Benzinga via TradingView: Salesforce leads software rout before Anthropic IPO
- MLQ.ai: Salesforce and ServiceNow fall as software stocks slide
- RiskReversal: S&P testing 200 day, Nvidia higher after hours
- StockAnalysis: Salesforce (CRM) price history
- StockAnalysis: Intuit (INTU) price history
- StockAnalysis: ServiceNow (NOW) price history
- StockAnalysis: Workday (WDAY) price history
- StockAnalysis: Datadog (DDOG) price history
- StockAnalysis: Microsoft (MSFT) price history
- StockAnalysis: Home Depot (HD) price history
- StockAnalysis: Disney (DIS) price history
- StockAnalysis: NVIDIA (NVDA) price history
- StockAnalysis: Energy Select Sector SPDR (XLE) price history
- StockAnalysis: Industrial Select Sector SPDR (XLI) price history
- StockAnalysis: Consumer Discretionary Select Sector SPDR (XLY) price history
- StockAnalysis: Technology Select Sector SPDR (XLK) price history
- StockAnalysis: Materials Select Sector SPDR (XLB) price history
- StockAnalysis: Consumer Staples Select Sector SPDR (XLP) price history
- StockAnalysis: Health Care Select Sector SPDR (XLV) price history
- StockAnalysis: Communication Services Select Sector SPDR (XLC) price history
- StockAnalysis: Real Estate Select Sector SPDR (XLRE) price history
- StockAnalysis: Utilities Select Sector SPDR (XLU) price history
- StockAnalysis: Financial Select Sector SPDR (XLF) price history
- Wikipedia: List of S&P 500 companies