
PnL, short for profit and loss, is the amount a trader has gained or lost on a position, a trade, or an account over a period. It has two parts: realized P&L from positions that are closed, and unrealized P&L from positions that are still open and valued at the current market price. Platforms write the same idea as P&L, P/L, or PNL.
A P&L figure shows how much was gained or lost, not whether the decision behind it was sound. It also depends on definitions that differ by platform: whether fees are included, which price the day is measured from, and, in crypto, where the day begins.
What Is PnL in Trading?
PnL measures the change in value that a trade or an account has produced, and net P&L is usually quoted after fees. For a long position, the basic arithmetic is (exit price − entry price) × quantity − fees, and an open position uses the current market price in place of the exit price. The period should be named whenever a figure is quoted: one trade, one day, one month, or a whole account.
A gain or loss is realized when an asset is sold for more or less than was paid for it. The SEC's Investor.gov describes a capital gain or loss this way, and its sample brokerage statement reports realized and unrealized gains and losses separately. In this post, realized P&L is the result locked in by a sale, and unrealized P&L is the difference between an open position's current market value and its cost. Valuing an open position at the latest market price is called mark-to-market, which the Nasdaq glossary describes as an adjustment of the book value or collateral value of a security to reflect current market value.
Realized vs Unrealized P&L
Realized P&L is fixed once a position is closed. Unrealized P&L is an estimate that changes with every price update until the position is closed, and Webull's help page calls the same figure Open P&L.
A hypothetical trader buys 100 shares at $50.00 and sells 40 at $55.00, so realized P&L is (55.00 − 50.00) × 40 = +$200.00. The other 60 shares are marked at $54.00, so unrealized P&L is (54.00 − 50.00) × 60 = +$240.00 and total P&L is +$440.00. If the price then falls to $48.00, realized P&L stays at +$200.00, unrealized P&L becomes −$120.00, and total P&L drops to +$80.00. All figures are before fees.
The example uses a single entry price. With several entries, the split depends on the platform's cost-basis method, and an average price calculator can compute the average entry price from several fills.
A realized-only view can understate risk. In trading records for 10,000 accounts at one large US discount brokerage from 1987 to 1993, investors were more ready to sell winners than losers (Odean, 1998). They sold 14.8% of the positions showing a gain and 9.8% of those showing a loss on days when they sold anything. This pattern is known as the disposition effect: selling winners more readily than losers. Open losses stay out of realized P&L until the positions close.

How to Calculate PnL: Long, Short, and Net of Fees
How Is P&L Calculated on a Long Position?
A long position gains when the price rises, so the formula is (exit price − entry price) × quantity. A hypothetical purchase of 100 shares at $50.00, sold at $54.00, gives (54.00 − 50.00) × 100 = +$400.00 before fees. The same formula applies to spot crypto, as the table below shows.
How Is P&L Calculated on a Short?
A short position gains when the price falls, so the prices reverse: (entry price − exit price) × quantity. The SEC describes a short sale as the sale of a stock the seller does not own, typically borrowed through a brokerage firm, with a profit if the price falls and a loss if it rises. A hypothetical short sale of 100 shares at $40.00, bought back at $43.00, gives (40.00 − 43.00) × 100 = −$300.00 before fees.
Two costs sit outside the price difference. The SEC states that the brokerage firm charges interest on the borrowed stock and that a dividend paid on the borrowed shares must be passed to the lender. It also notes that a short position leaves an investor open to the possibility of unlimited losses, because a stock price can theoretically keep rising.
How Do Fees Change P&L?
Gross P&L ignores costs, and net P&L subtracts commissions and other fees: net P&L = gross P&L − fees. Platform definitions differ in what they include. Interactive Brokers includes commissions in the cost behind both realized and unrealized P&L, and Webull's cumulative P&L also lists dividends and margin interest.
The table assumes $1.00 per side for the stock trades and 0.1% of trade value per side for the crypto trade. A crypto fee may be charged in the traded coin or another token, and it then needs converting into the quote currency. Binance's trade-list endpoint, for example, returns a commission amount and a commission asset for every fill.
What Does P/L Day Mean on a Brokerage Platform?
P/L Day, also labeled Day's P&L, Daily P&L, or Today's Net Change, is usually the change in the value of a position or an account since the previous close, including open positions. It is measured from a prior reference price, not from the entry price, so a position bought a month ago can show a small P/L Day and a large total gain at once. Brokerage help pages differ on the reference point and the scope.
A hypothetical position of 100 shares was bought at $50.00 in an earlier session. It closed at $54.00 yesterday and trades at $55.00 now. P/L Day is (55.00 − 54.00) × 100 = +$100.00, while the gain since entry, which thinkorswim labels P/L Open, is +$500.00. If the shares are sold at $55.00 today, Webull's formula still gives +$100.00 for the day (5,500 sold minus 5,400 of previous-close market value), while the realized P&L of the trade is +$500.00.
The SEC's Extended-Hours Trading: Investor Bulletin states regular trading hours for US stocks as 9:30 a.m. to 4:00 p.m. Eastern Time. It warns that extended-hours prices may not match the regular-session close or the next open, so a platform's treatment of those hours can change its day figure.
PnL in Crypto: Where Does the 24/7 Day Start?
Crypto spot markets trade around the clock, so there is no official daily close, and a daily P&L depends on the boundary the platform chooses. Binance's Spot API documentation interprets daily candles in UTC unless another time zone is requested, and its 24-hour ticker is a rolling window. Binance's support article bases its Today's PNL statistics on UTC.
The conventions can disagree for the same holding. A hypothetical 0.5 BTC is priced at 60,000 USDT at 00:00 UTC and 61,000 USDT at 20:00 UTC, and it was 59,000 USDT at 20:00 UTC the day before. Measured from the UTC day boundary, the day's P&L is 0.5 × (61,000 − 60,000) = +500 USDT. Measured over a rolling 24 hours, it is 0.5 × (61,000 − 59,000) = +1,000 USDT.
For a trader on New York time, midnight UTC falls at 8 p.m. during daylight saving time and 7 p.m. otherwise.
Reading a PnL Calendar: Daily and Monthly Cells
A PnL calendar places each day's result in a calendar cell, usually colored by profit or loss, with weekly or monthly totals. Trading Journl shows a P&L calendar with daily and monthly results from saved trades. Two readings are worth checking:
- Concentration. Whether a few large cells account for most of a month. A month can finish positive with more losing days than winning days, because a cell shows an amount, not a count.
- Streaks. In a hypothetical model, days are independent, 55% are profitable, and 45% are losing. The chance of at least one run of five losing days within 100 trading days is then about 65%, from the standard run-length recursion. Real results need not be independent, but a streak alone does not prove a change in skill.
A calendar of closed-trade results shows nothing on a day with no closed trades, even if open positions moved sharply.
Drawdown: How Far P&L Falls From Its Peak
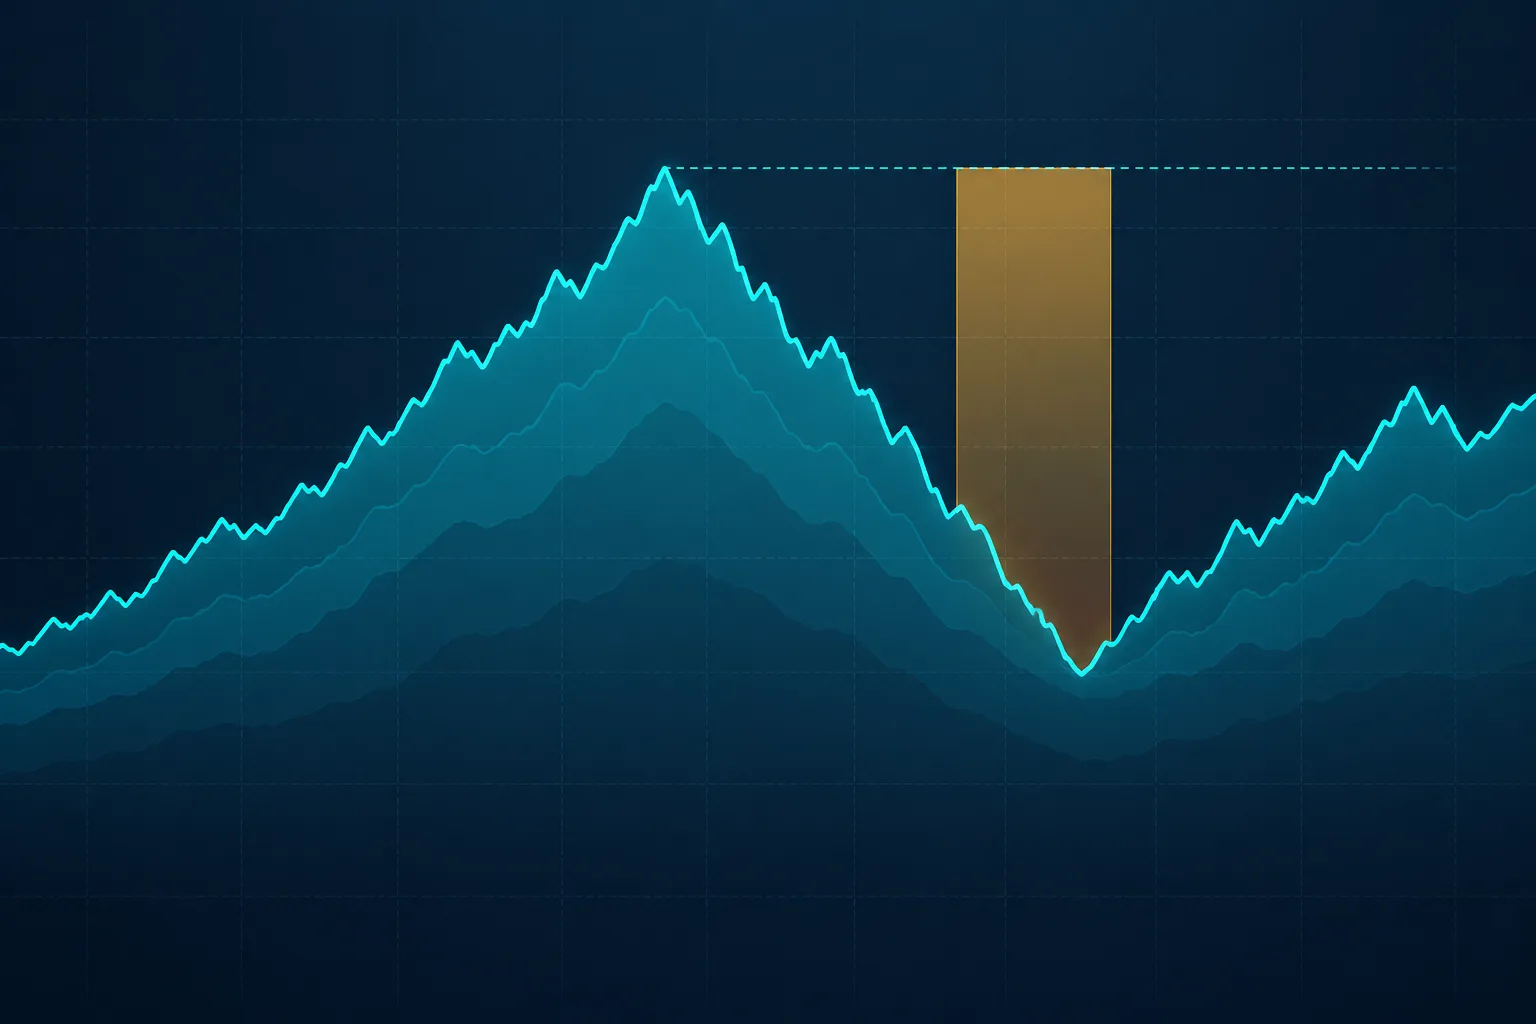
Drawdown is the decline from a peak in cumulative P&L or account equity to a later low, measured before the earlier peak is regained. The CFTC's rules for commodity pool operators and trading advisors define the worst peak-to-valley draw-down as the greatest cumulative percentage decline in month-end net asset value before the earlier value is equaled or exceeded (17 CFR 4.10). That measure is a month-end disclosure for pools, so it is coarser than a trade-level drawdown. The same idea can be applied to daily or per-trade data and stated in currency or percent.
A hypothetical account starts at $10,000, rises to $13,000, and falls to $11,200 before recovering. The drawdown is $1,800, or 13.8% of the peak. Regaining the peak takes a 16.1% gain from the trough, because the gain applies to a smaller base. A 20% decline needs a 25% gain, and a 50% decline needs a 100% gain.
A drawdown measured only on closed trades can differ from one measured on equity, which includes open positions, so a reported maximum drawdown should say which basis it uses. Loss limits that keep drawdowns tolerable are covered in trading risk management.
Limitations and Risks
- Definitions differ. The same trades can produce different day figures on different platforms, because each sets its own reference point and may treat fees, dividends, and interest differently.
- Unrealized P&L is an estimate. It is valued at the latest price, but the SEC's Understanding Order Types bulletin notes that the last-traded price is not necessarily the price at which a market order will execute. Execution often deviates from it because of demand and available liquidity. Webull describes its displayed P&L as informational, and Binance describes its PNL as for reference only.
- Outcomes are not decisions. In experiments where participants judged decisions made by others, the thinking behind a decision was rated as better when its outcome was favorable (Baron and Hershey, 1988). Participants understood that they had all the information available to the decision maker. A P&L figure is an outcome, so it can invite the same bias when it is the only evidence.
P&L also says little about how results are distributed across trades. Win rate and profit factor describe that distribution, and a trading journal records the reasons behind each trade.
A Checklist Before Acting on a PnL Number
- Is the period stated: one trade, one day, one month, or the whole account?
- Is the figure realized, unrealized, or the sum of both?
- Are fees included, and are dividends, interest, and borrowing costs treated the same on every platform compared?
- Is the day measured from the prior close, a UTC boundary, or a rolling 24 hours?
- Do a few large days account for most of the result?
- Does the maximum drawdown fit the loss that was planned for, not only the net P&L?
- Have the reasons for the trades been recorded, so the result can be judged on process as well as outcome?
Frequently Asked Questions
Is Unrealized P&L Real Money?
Not until the position is closed. Unrealized P&L is the gain or loss on a position that is still open, and it can shrink or reverse before the exit. A gain or loss is realized when the asset is sold, and on Interactive Brokers unrealized P&L is described as theoretical until the position is closed.
How Is P&L Percentage Calculated?
For a single trade, the percentage is the P&L divided by the amount invested, so a hypothetical +$400.00 gain on a $5,000.00 entry is 8.0%. Platforms differ in the base: thinkorswim divides P/L Open by the execution price, while Webull's standard formula divides cumulative income by initial cost and warns that deposits and withdrawals can distort it.
Key Takeaways
PnL is the gain or loss on a trade, a day, or an account, and its meaning depends on three definitions: realized or unrealized, gross or net, and which day boundary applies.
- Realized P&L is fixed at the exit, while unrealized P&L is a mark-to-market estimate that changes with every price update.
- Net P&L subtracts fees, and some platforms also fold dividends and margin interest into total P&L.
- P/L Day and Day's P&L measure change from a prior reference point, not from the entry price, and the reference point differs by platform.
- Crypto has no official daily close, so a day's P&L depends on a UTC boundary or a rolling 24 hours.
- A PnL calendar and a drawdown figure add context, but streaks occur even when results are random, and results alone say little about decision quality.
When a P&L figure leads to a change in plan, recording the period, the fee treatment, and the day boundary behind it makes it easier to review later whether the change was justified.
References
- SEC Investor.gov, "Better Understanding Your Brokerage Account Statement," retrieved October 2, 2026. Investor.gov
- SEC Office of Investor Education and Advocacy, "Understanding Order Types: Investor Bulletin," July 12, 2017, updated August 18, 2026. Investor.gov
- Interactive Brokers, Traders' Glossary, "Unrealized P&L," retrieved October 1, 2026. interactivebrokers.com
- Interactive Brokers, Trader Workstation User Guide, "Profit and Loss," last updated October 8, 2025. ibkrguides.com
- Charles Schwab, thinkorswim Learning Center, "Position Statement," retrieved October 1, 2026. thinkorswim.com
- Webull, Help Center, "Profit and Loss (P&L)," retrieved October 1, 2026. webull.com
- Fidelity, Fidelity Trader Pro Help, "Account Summary," retrieved October 1, 2026. fidelity.com
- Nasdaq, Glossary of Stock Market Terms, "Mark-to-market," retrieved October 1, 2026. nasdaq.com
- SEC, "Key Points About Regulation SHO," modified May 31, 2022. sec.gov
- SEC Office of Investor Education and Advocacy, "Extended-Hours Trading: Investor Bulletin," June 6, 2022. Investor.gov
- Binance, Spot API documentation, REST API: "Kline/Candlestick data," "24hr ticker price change statistics," and "Account trade list (USER_DATA)," retrieved October 1, 2026. GitHub
- Binance Support, "How to View My Binance Spot Account PNL?" updated January 8, 2026. binance.com
- Commodity Futures Trading Commission, 17 CFR 4.10(k) and (l), definitions of draw-down and worst peak-to-valley draw-down. eCFR
- Odean, T., "Are Investors Reluctant to Realize Their Losses?" The Journal of Finance 53(5), 1775–1798, 1998. doi:10.1111/0022-1082.00072
- Baron, J., and Hershey, J. C., "Outcome Bias in Decision Evaluation," Journal of Personality and Social Psychology 54(4), 569–579, 1988. doi:10.1037/0022-3514.54.4.569
For reference only: The information in this post is provided for general reference and does not constitute investment advice or a solicitation to trade. Your responsibility: Final investment decisions and their outcomes are entirely your own. No warranty: This information is not guaranteed to be accurate and cannot be used as a basis for legal liability for any investment result.