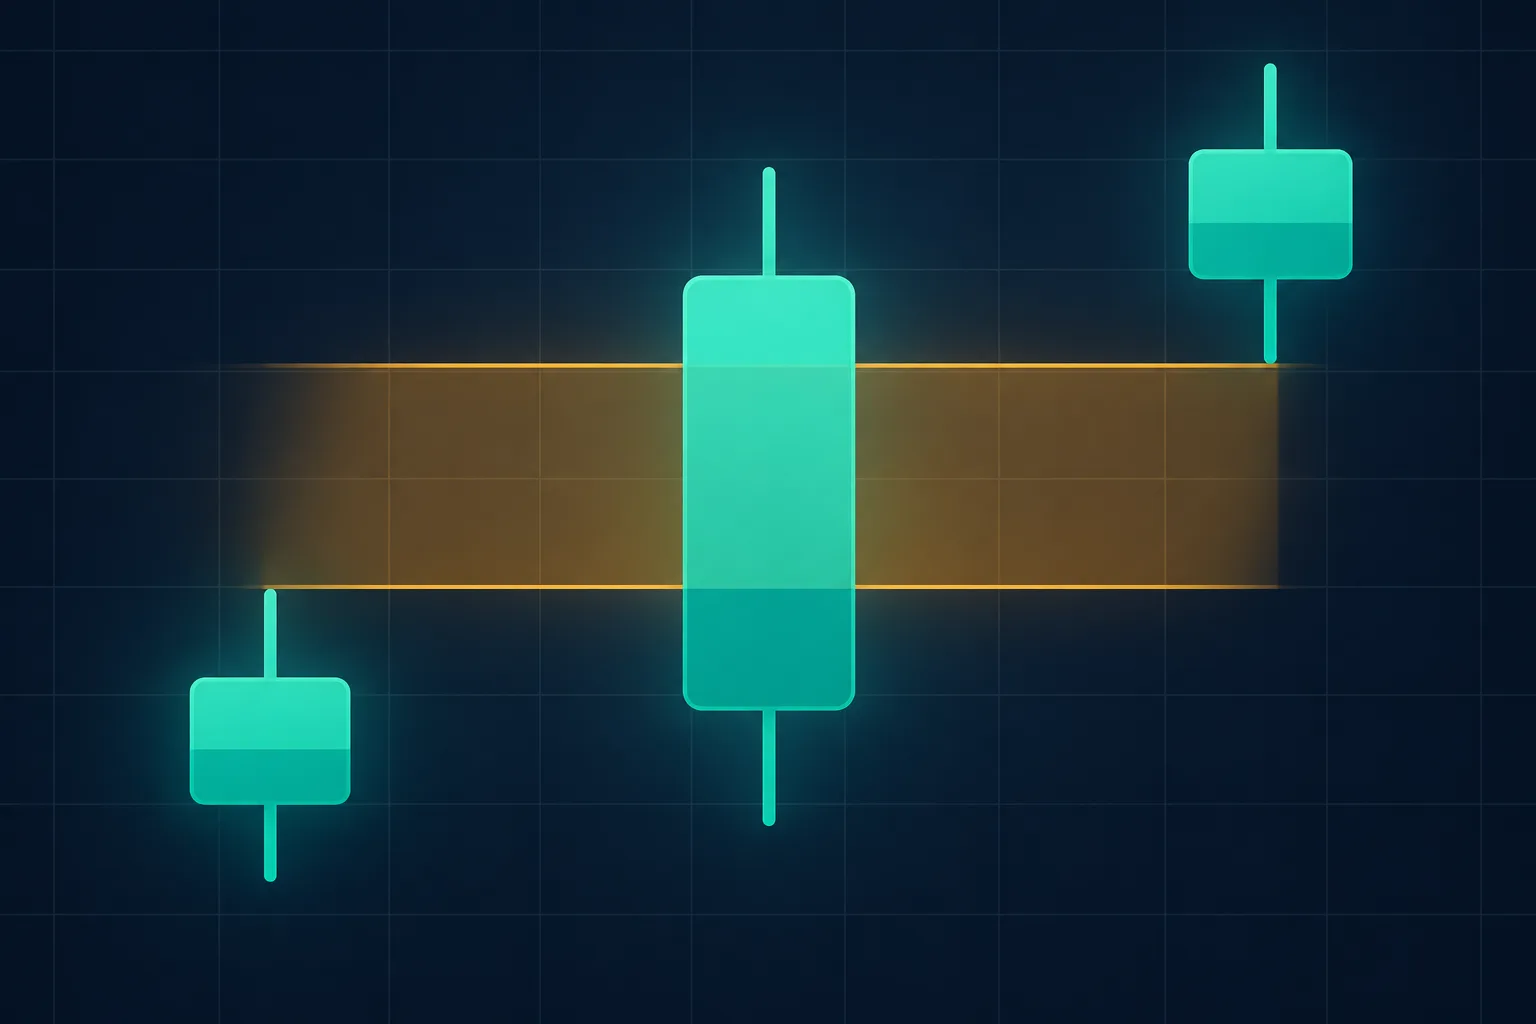
The fair value gap meaning is mechanical. A fair value gap (FVG) is a three-candle chart pattern in which the first and third candles leave part of the price range uncovered. In the bullish form, candle 1's high is below candle 3's low, and a tall candle 2 spans the space between them. The bearish form is the exact mirror: candle 1's low is above candle 3's high. Traders call the uncovered zone between those two levels an imbalance.
An FVG is a retail trading term, not a standard or academic one. It is associated with the ICT (Inner Circle Trader) and smart money concepts communities, which are named here for transparency and not as authorities. The term does not appear in the cited chapters of the two classic textbooks. This post defines it mechanically, relates it to the price gaps those textbooks cover, and explains why its usefulness is unproven. It makes no claim that FVGs predict price.
In short: A bullish FVG has the low of candle 3 above the high of candle 1. A bearish FVG has the high of candle 3 below the low of candle 1. This guide also requires candle 2's range to overlap both neighbors.
What Is a Fair Value Gap?
A fair value gap is a zone on a candlestick chart that only one candle traded through. Three consecutive candles on the same timeframe create it. Candle 2 moves so far and so fast that candle 1 and candle 3 do not overlap, while candle 2 itself overlaps both of them. The span between candle 1 and candle 3 is the zone. Traders also call it an imbalance or an inefficiency.
One rough analogy is a stretch of road that a car crossed once, at speed, while nothing else stopped there. The analogy describes the structure only. It says nothing about what price does next.
Two parts of the name are informal. "Fair value" is not a valuation concept here, and no model estimates a fair price. "Gap" is looser than in classic usage, because price did trade inside the zone during candle 2.
A Retail Concept, Not a Textbook Term
The usual explanation, that large participants move price aggressively and later return to rebalance it, comes from retail trading communities. No source cited here shows that it holds. It is a hypothesis, not a finding.
That does not make the pattern meaningless. It means a trader must gather the evidence for any particular use of it, from a sample large enough to mean something.
Bullish and Bearish Fair Value Gaps
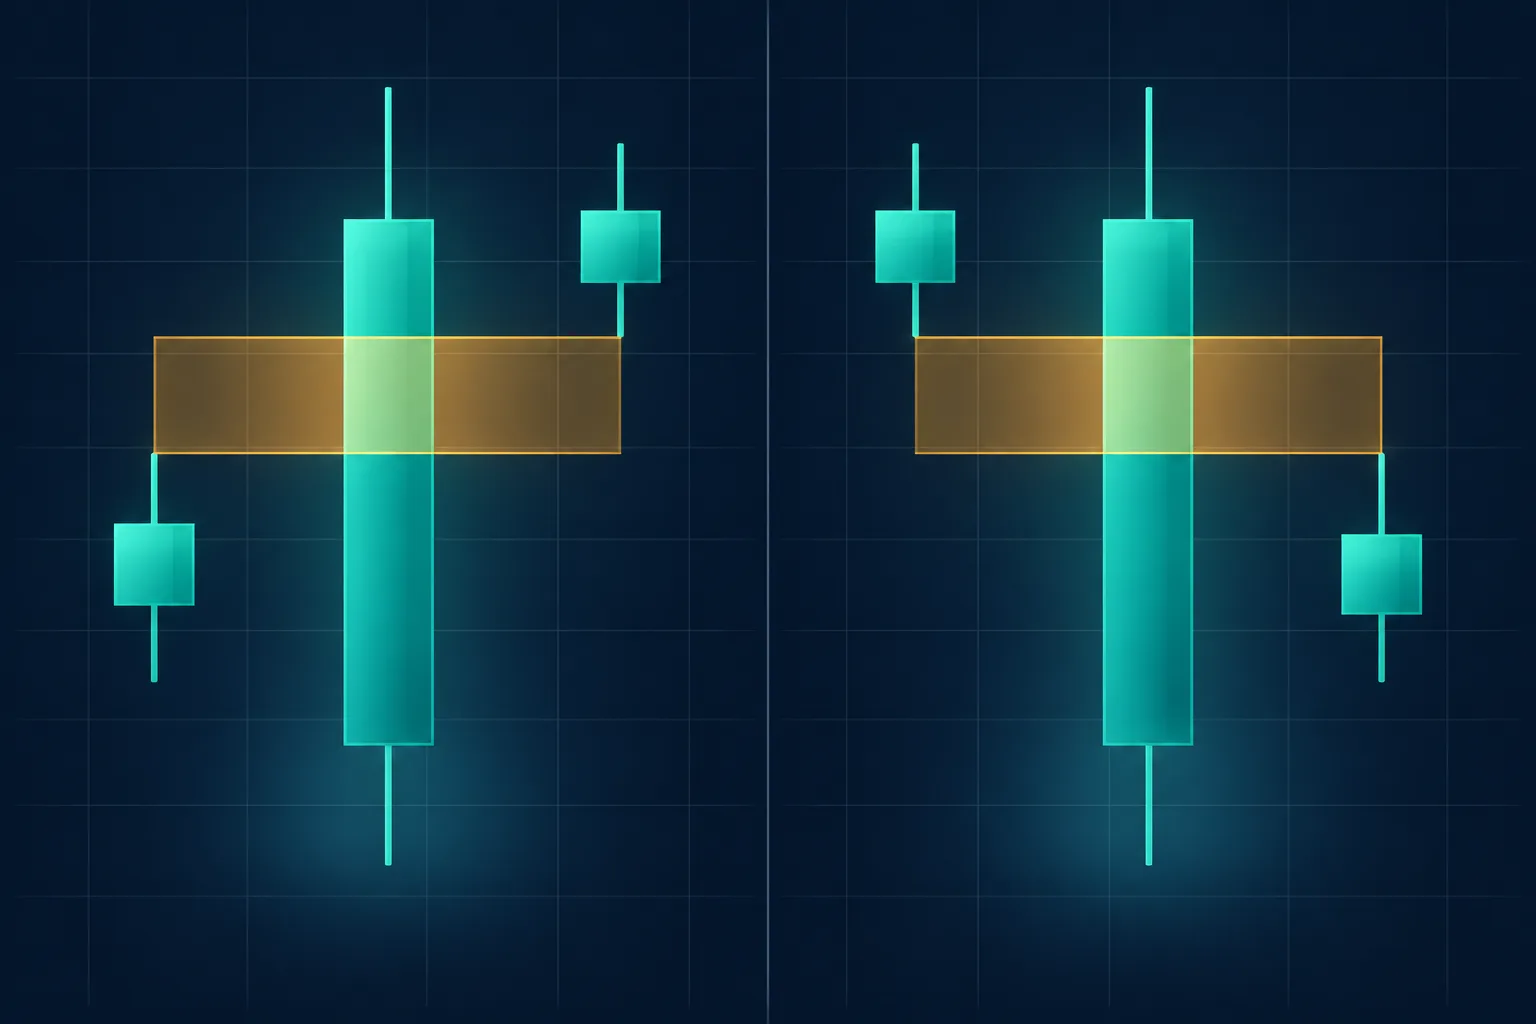
The two forms are defined by the same three-candle test, applied in opposite directions. Wicks count, so the test uses highs and lows, not candle bodies.
How Does an FVG Relate to Classic Price Gaps?
In Technical Analysis of Stock Trends, Edwards and Magee describe a gap as "a price range at which (at the time it occurred) no shares changed hands." A daily gap exists when one day's lowest price is above the preceding day's highest price, so the two ranges do not touch.
An FVG differs in one respect. Candle 2 overlaps both of the other candles, so its range covers the whole zone. Shares did change hands there, but only inside one candle.
Suppose candle 2 did not cover the zone. Part of the zone would then be a classic gap that no candle traded. This guide excludes such zones, although some community definitions include them. Either way, the FVG is a three-candle relative of the classic gap, not the same object.
Edwards and Magee also explain why breakaway gaps appear. Using an ascending triangle as the example, they describe supply at a fixed price being absorbed until the next buyer "finds none offered" just above it and has to bid up to get shares. Community explanations of an FVG reuse this idea of an imbalance, although no source cited here tests it.
A third classic idea is support and resistance. In Technical Analysis of the Financial Markets, John Murphy defines support as a level or area under the market where buying interest is strong enough to overcome selling pressure.
For breakaway gaps, he writes that upside gaps usually act as support areas on later corrections. He adds that a close below an upward gap is a sign of weakness. Traders who watch an FVG as a retracement zone are applying a version of that logic to a smaller pattern.
How to Identify a Fair Value Gap
The rules below are mechanical, so two people applying them to the same chart should find the same zones. The size rule in step 5 is a convention, and its threshold is a choice.
- Fix one timeframe before scanning. The same market can show an FVG on 5-minute candles and none on 1-hour candles.
- Take three consecutive candles and use their full ranges, including wicks.
- Test the condition. For a bullish FVG, the low of candle 3 must be above the high of candle 1. For a bearish FVG, the high of candle 3 must be below the low of candle 1.
- Check that candle 2's range overlaps both candle 1 and candle 3, so that it covers the whole zone. This guide applies a stricter reading. If candle 2 does not cover the zone, part of it is a classic gap that was never traded, so the guide does not count it. Some community definitions also count zones that candle 2 gapped over.
- Check candle 2's size. Community teaching says it should be a large, one-directional candle, often called displacement. One possible rule is to require that its range exceeds a multiple of the recent average candle range. Choose the multiple in advance.
- Record the zone edges, the zone width, and the time. Then track the status as unfilled, partly filled, or filled.
Edwards and Magee say a gap is closed when a later trend "comes back and retraces the range of the gap." For an FVG, a common convention is to call it partly filled when price trades into the zone. It is fully filled when price reaches the far edge.
Worked Example: A Bullish FVG (Hypothetical US Stock)
The following numbers are hypothetical. A US stock trades on 5-minute candles. Candle 1 has a high of 101.20 USD. Candle 2 has a low of 101.00 and a high of 103.40, so its range is 2.40 USD and overlaps both neighbors. Candle 3 has a low of 102.30 USD.
Candle 3's low of 102.30 is above candle 1's high of 101.20. Candle 2's low of 101.00 is below 101.20 and its high of 103.40 is above 102.30, so it covers the zone and a bullish FVG exists. The zone runs from 101.20 to 102.30 USD, a width of 1.10 USD, which is about 46% of candle 2's range. The midpoint is 101.75 USD.
Later, price falls to 102.00 USD and turns. It entered the zone and covered about 0.30 of the 1.10 USD width, so the gap is partly filled. It would be fully filled only if price traded back to 101.20 USD.
Reader check: does the bearish example below meet the overlap rule? Compare candle 2's high and low with both neighbors before reading the answer.
Worked Example: A Bearish FVG (Hypothetical Crypto Pair)
The numbers are again hypothetical. On BTCUSDT 15-minute candles, candle 1 has a low of 64,200 USDT. Candle 2 has a high of 64,300 and a low of 63,700, a range of 600 USDT. Candle 3 has a high of 63,900 USDT.
Candle 3's high of 63,900 is below candle 1's low of 64,200. Candle 2's high of 64,300 is above 64,200 and its low of 63,700 is below 63,900, so it covers the zone and a bearish FVG exists. The zone runs from 63,900 to 64,200 USDT, a width of 300 USDT. The midpoint is 64,050 USDT. The mirror-image rule applies: price rising back into the zone is the retracement. The two charts in this post are real illustrations of the pattern, and their prices differ from the hypothetical figures in the worked examples.
How Traders Mark and Track an FVG
A common practice in community teaching is to draw a rectangle between the two zone edges, starting at the candle 1 edge. That edge is candle 1's high for a bullish FVG and its low for a bearish one. The rectangle is then extended to the right while the zone stays unfilled. When price enters it, the trader notes the status as partly filled, and when price reaches the far edge, as filled.
Each zone is easier to review later when the timeframe, the edges, the time of formation, and the fill status are written down at the same moment.
How Traders Use an FVG as a Retracement Zone
A common practice in community teaching is to treat an unfilled FVG as a place where price may return and react. A trader marks the zone, waits for price to come back into it, and looks for a reaction before acting. Some use the midpoint as a reference level. Others use the far edge of the zone as the level where the idea is wrong.
That description is what is taught, not what has been validated. The sources cited in this post do not test whether FVGs predict anything, and this post makes no performance claim.
One caution comes from Edwards and Magee. They note that the probabilities they state for a gap being closed "apply just as well to a stock's returning to any price range at which it has once been traded, gap or no gap." Price often revisits earlier ranges. A fill alone therefore does not show that the FVG caused anything.
If a close beyond the zone is treated as a failed zone, the opposing role of that zone becomes the subject of the inverse fair value gap. Any such setup belongs in a written trading plan with the entry condition, invalidation level, and position size fixed before the trade. The reward and risk of a planned level can be checked with the risk/reward calculator.
FVG vs. Opening Gap
An opening gap is a classic price gap between one session's close and the next session's open. It is visible on a daily chart. An FVG is a three-candle structure that can appear on any timeframe, including inside a single session.
A candle that opens with a gap and never trades back into the previous candle's range does not overlap it. The untraded space between those two candles is a classic gap, and under this guide's stricter overlap rule it is not counted as an FVG, although some community definitions would count it. The two measurements differ, so a chart should label them separately.
US Stocks vs. Crypto
In US stocks, overnight gaps and intraday FVGs coexist. The SEC's Investor.gov bulletin on extended-hours trading states that regular trading hours for exchange-traded stocks run from 9:30 a.m. to 4:00 p.m. Eastern Time. Whether an overnight gap appears depends on whether a chart includes extended-hours data.
The same bulletin warns that extended-hours trading generally has less trading interest, wider spreads between bid and ask prices, and price changes tied to news released outside regular hours. A gap or FVG formed in thin extended-hours candles may reflect those conditions more than a lasting shift in supply and demand.
Crypto spot markets such as Binance BTCUSDT trade continuously. A 24/7 market has no session close, so session-based opening gaps do not apply, and FVGs in crypto are intraday three-candle patterns. A candle can still open away from the previous close when a market moves quickly, which is why the overlap rule matters. Different exchanges can also print different highs and lows, so the same zone may not exist on every venue.
Clearer vs. Weaker FVG Readings
No source cited here separates FVGs that work from those that do not. The distinction below is about how clearly a zone is defined, not about reliability.
A zone is clearer when the following hold.
- Candle 2 is large relative to the recent average candle range.
- The zone is wide compared with typical spreads and fees for that market.
- The three candles formed during regular, liquid trading hours.
- The same zone is visible without adjusting the timeframe or the rules after the fact.
A zone is weaker when the following apply.
- The width is close to the bid-ask spread or the round-trip fee, so costs consume the room.
- The pattern formed in thin extended-hours trading or on a news spike.
- Many small overlapping zones sit in the same choppy range.
- Price has already traded through most of the zone.
Limitations and Risks
Subjectivity is the first limit. Rules for candle 2, the timeframe, and what counts as a fill are conventions, and changing them changes which zones appear. A rule chosen after viewing the outcome is hindsight, not a test.
Timeframe dependence is the second. Candles on a lower timeframe combine into one candle on a higher timeframe, and the combined candle can overlap what was a gap. A 5-minute FVG can disappear on a 1-hour chart.
Third, a zone may draw no reaction. Price can pass through it, ignore it, or return days later in a different context. Remembering the zones that worked and forgetting the others is a general risk of reviewing charts by eye.
Fourth, costs and execution matter. A narrow zone can sit inside the spread, and a fast market can fill an order away from the planned price.
Finally, a sample of a few zones says very little. Judging whether FVGs help in a market requires logging every zone that meets the rule, not only the ones that worked. A trading journal holds that record, and Trading Journl chart review has a rectangle drawing tool that can mark a zone next to a saved trade's entry and exit markers.
A Checklist Before Acting
- Is the three-candle condition met using highs and lows, with the timeframe fixed in advance?
- Does candle 2 overlap both candle 1 and candle 3, and is it large under a size rule written before the trade?
- Is the zone wide enough to survive spread, fees, and slippage?
- Did the pattern form during regular, liquid hours?
- Is the invalidation level defined before entry?
- Is the position size set from the planned loss, not from the pattern?
- Will this zone be logged with its outcome, whether it is filled or not?
Frequently Asked Questions
Do Fair Value Gaps Always Get Filled?
No. Edwards and Magee call "a gap must be closed" the most common superstition about gaps. Murphy calls the maxim "gaps are always filled" "simply not true." Both discuss classic gaps, so the point carries over to FVGs only by analogy. No cited source gives a fill rate for FVGs.
What Is the Difference Between a Bullish and a Bearish FVG?
A bullish FVG has a candle 3 low above the candle 1 high, after a tall rising candle 2. A bearish FVG has a candle 3 high below the candle 1 low, after a tall falling candle 2. Everything else, including the zone and fill definitions, mirrors.
What Is an Inverse Fair Value Gap?
It is a zone that price has closed through, after which traders watch it with the opposite role. It is also a community-defined idea. The inverse fair value gap post covers the definition and the role reversal from classic support and resistance.
Key Takeaways
A fair value gap is a precise way to mark a three-candle zone, but a mark on a chart is not evidence that price will react to it.
- An FVG is a three-candle pattern: candle 1's high is below candle 3's low (bullish), or candle 1's low is above candle 3's high (bearish), with a tall candle 2 between them that overlaps both.
- It is a retail community concept. The classic references cited here define price gaps and support and resistance, not FVGs.
- Unlike a classic gap, price did trade in the zone, but only inside candle 2.
- Classic sources warn that gaps are not always filled, and that price often revisits earlier ranges whether a gap is present or not.
- Zones depend on the timeframe, the data, and the size rule, so the rules should be written before the outcome is known.
- No performance claim is made here, and a trader needs a logged sample to learn whether the pattern helps.
If an FVG feeds a trade decision, recording the timeframe, the zone edges, the size rule, and the outcome makes it possible to review later whether the idea held up.
References
- Robert D. Edwards and John Magee, Technical Analysis of Stock Trends, 9th ed. (revised by W.H.C. Bassetti), CRC Press, 2007, Chapter 12, "Gaps" (beginning p. 211)
- John J. Murphy, Technical Analysis of the Financial Markets, New York Institute of Finance, 1999, Chapter 4, "Basic Concepts of Trend" (support and resistance, pp. 55-64; price gaps, pp. 94-98)
- SEC Office of Investor Education and Advocacy, "Extended-Hours Trading: Investor Bulletin", Investor.gov, June 6, 2022
For reference only: The information in this post is provided for general reference and does not constitute investment advice or a solicitation to trade. Your responsibility: Final investment decisions and their outcomes are entirely your own. No warranty: This information is not guaranteed to be accurate and cannot be used as a basis for legal liability for any investment result.