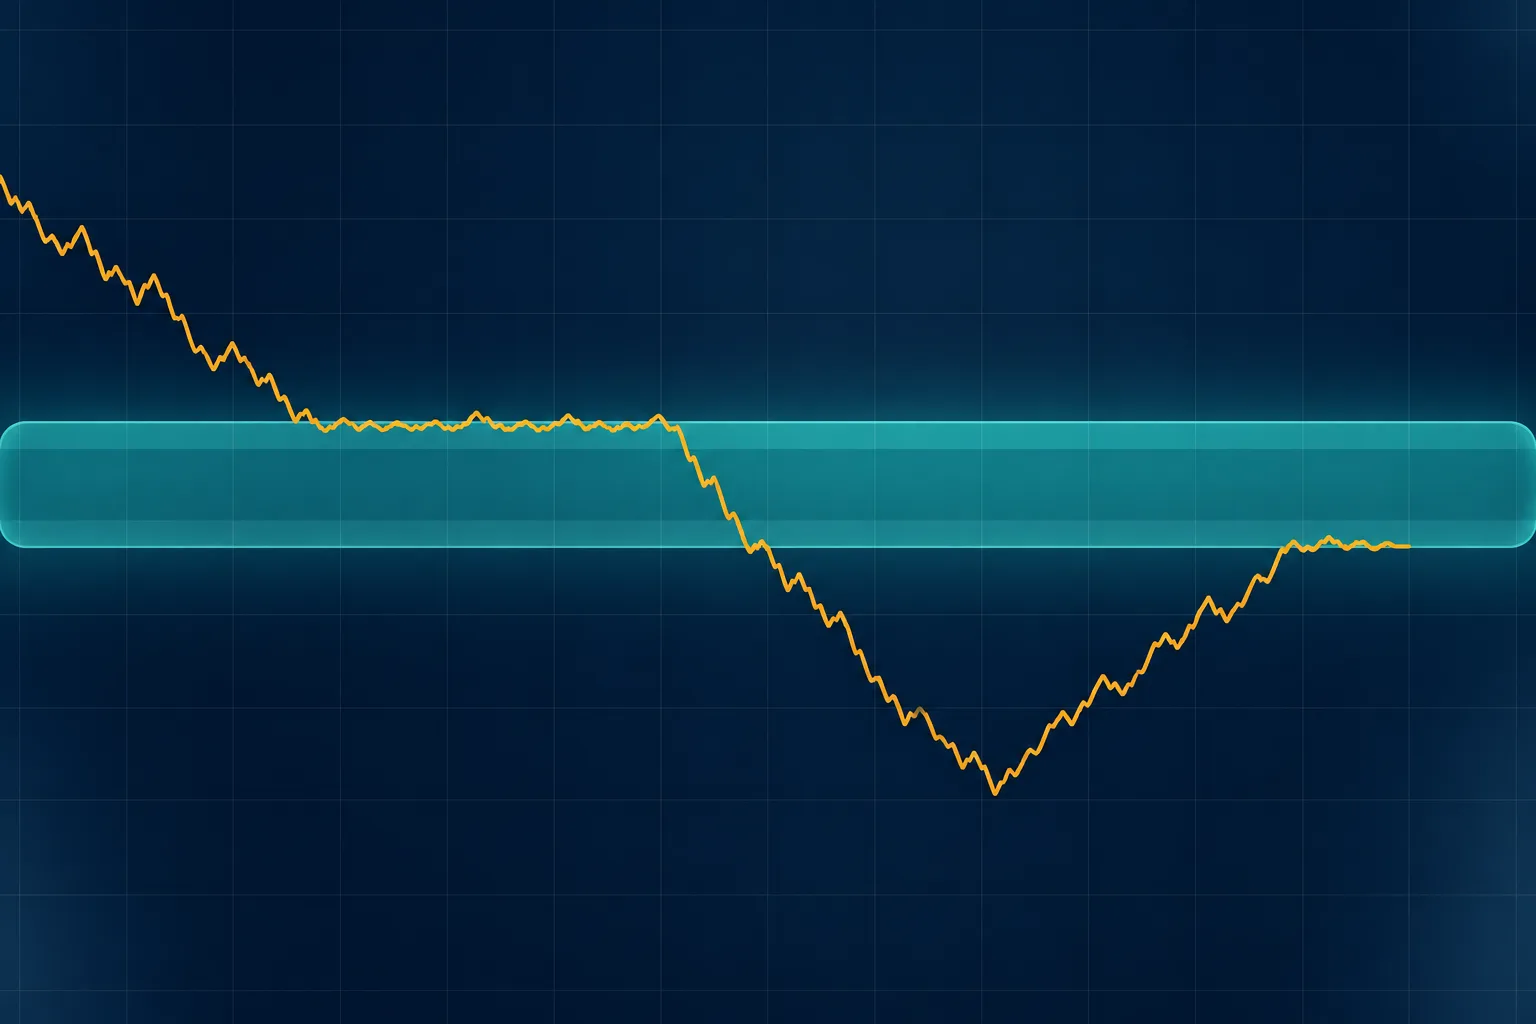
An inverse fair value gap (IFVG) is a fair value gap that price closes through, after which traders watch the same zone with the opposite role. A bullish gap that price closes below is then treated as possible resistance, and a bearish gap that price closes above is then treated as possible support. The idea is also called an inversion FVG.
The IFVG is a community-defined concept, not a standard term in textbooks or academic research, and no peer-reviewed test of it was found for this post. Definitions differ between sources, and a zone that "should" react may not. The sections below separate what is established, which is the role-reversal principle for support and resistance, from what is convention, which is the exact IFVG rules.
What Is an Inverse Fair Value Gap?
A fair value gap (FVG) is a three-candle pattern in which the first and third candles do not overlap. In the bullish case, the high of candle 1 is below the low of candle 3, and the zone between them lies inside the range of candle 2. The bearish case is the mirror image. The fair value gap guide covers the pattern in detail.
An IFVG starts from such a gap and adds one event: a later candle closes through the zone against its original direction. Once that close occurs, the zone is no longer read as a possible floor or ceiling in its original direction. It is read as the opposite. "Inverse FVG," "inversion FVG," and "IFVG" all name the same idea.
The role-reversal principle itself is older than the term. John Murphy calls it one of the "lesser known aspects of support and resistance" in Technical Analysis of the Financial Markets. When a level is penetrated by a significant amount, he writes, support and resistance "reverse their roles and become the opposite." Murphy explains the mechanism through positioning. Traders who bought at support and now hold losing positions may sell when price returns to that level, which turns the old support into resistance.
The IFVG applies this principle to a gap zone instead of a horizontal level. That step is an analogy made by the trading community. Murphy did not describe fair value gaps, and the analogy has not been tested in the sources reviewed here.
How to Identify an IFVG: Step-by-Step Rules
The rules below are one common reading. Because the concept is community-defined, any rule that a trader adopts should be written down in full and applied the same way each time.
- Mark an FVG on the chosen timeframe. Record the zone edges, which are the high of candle 1 and the low of candle 3 for a bullish gap.
- Wait for a candle to close beyond the far edge of the zone, against the gap's direction. For a bullish gap, that means a close below the bottom edge.
- Decide in advance whether a wick through the zone counts. Some descriptions require a candle close, not just a wick, but this is a choice, not a rule of nature.
- Treat the zone as inverted from the close onward. The same two edges now mark the area being watched in the opposite role.
- Define invalidation in advance. One common choice is a later close back through the zone in the original direction.
Some traders watch what happens when price returns to the inverted zone. A candle that closes back outside the zone is read as a rejection, and a candle that closes through it is read as a failed inversion.
Example: A Hypothetical US Stock
The following figures are hypothetical and are not taken from any real chart, including the illustration below. On a 5-minute chart of a US stock trading near 200, candle 1 has a high of 200.40. Candle 2 rises sharply, with a range of 200.30 to 201.60. Candle 3 has a low of 200.90.
The bullish FVG is the zone from 200.40 to 200.90, a width of 0.50. Some time later, a 5-minute candle closes at 200.15, below the bottom edge of 200.40. By the rule above, the gap is now inverted, and 200.40 to 200.90 is watched as possible resistance.
If price then rallies into the zone and a candle closes back below 200.40, the inversion held on that retest. If a candle closes above 200.90, the inversion failed under the rule in step 5.
Example: A Hypothetical Crypto Pair
Crypto trades around the clock, so the overnight gaps seen in US stocks do not occur. Gap zones on crypto charts form from candle sequences on whichever timeframe is used, and daily candles depend on the exchange's UTC boundary.
Again the numbers are hypothetical and unrelated to any real chart. On a 15-minute BTCUSDT chart, candle 1 has a low of 64,200 and candle 3 has a high of 63,900. That is a bearish FVG from 63,900 to 64,200. A later 15-minute candle closes at 64,350, above the top edge. Under the rules above, the zone is now watched as possible support.
Market Notes
US stocks can open with an overnight gap that is not an FVG, because an opening gap is a break between sessions, not a three-candle pattern. Trading outside the regular session can be thinner, so a close through a zone in those hours may reflect few participants. The same can apply to small altcoins, where a few orders can move a close across a zone.
IFVG vs. FVG: What Changes
The FVG describes an imbalance left behind by a fast move. The IFVG describes what happens after price rejects that imbalance by closing through it. The first is a pattern of three candles. The second is a pattern of a pattern, which is why IFVG signals depend on two choices at once: how the FVG was defined, and how "closing through" was defined.
A rule that requires a body close beyond the far edge finds fewer IFVGs than one that accepts a wick. Two traders can mark different zones on the same chart without either breaking a rule.
Reliable vs. Risky IFVG Setups
No test of IFVG reliability was found, so the criteria below are borrowed from Murphy's discussion of support and resistance and should be read as hypotheses.
Murphy lists three ways to judge how much trading took place at a level: the time spent there, the volume, and how recently the trading occurred. A zone where price spent more time, on heavier volume, and more recently fits his description of a more significant level. He also states that levels reverse roles only after a significant penetration, and he admits that "there is quite a bit of subjectivity involved" in deciding what is significant. His benchmarks of 3% for major levels and about 1% for shorter-term levels were written for chart levels in general and do not transfer to a three-candle gap on an intraday chart.
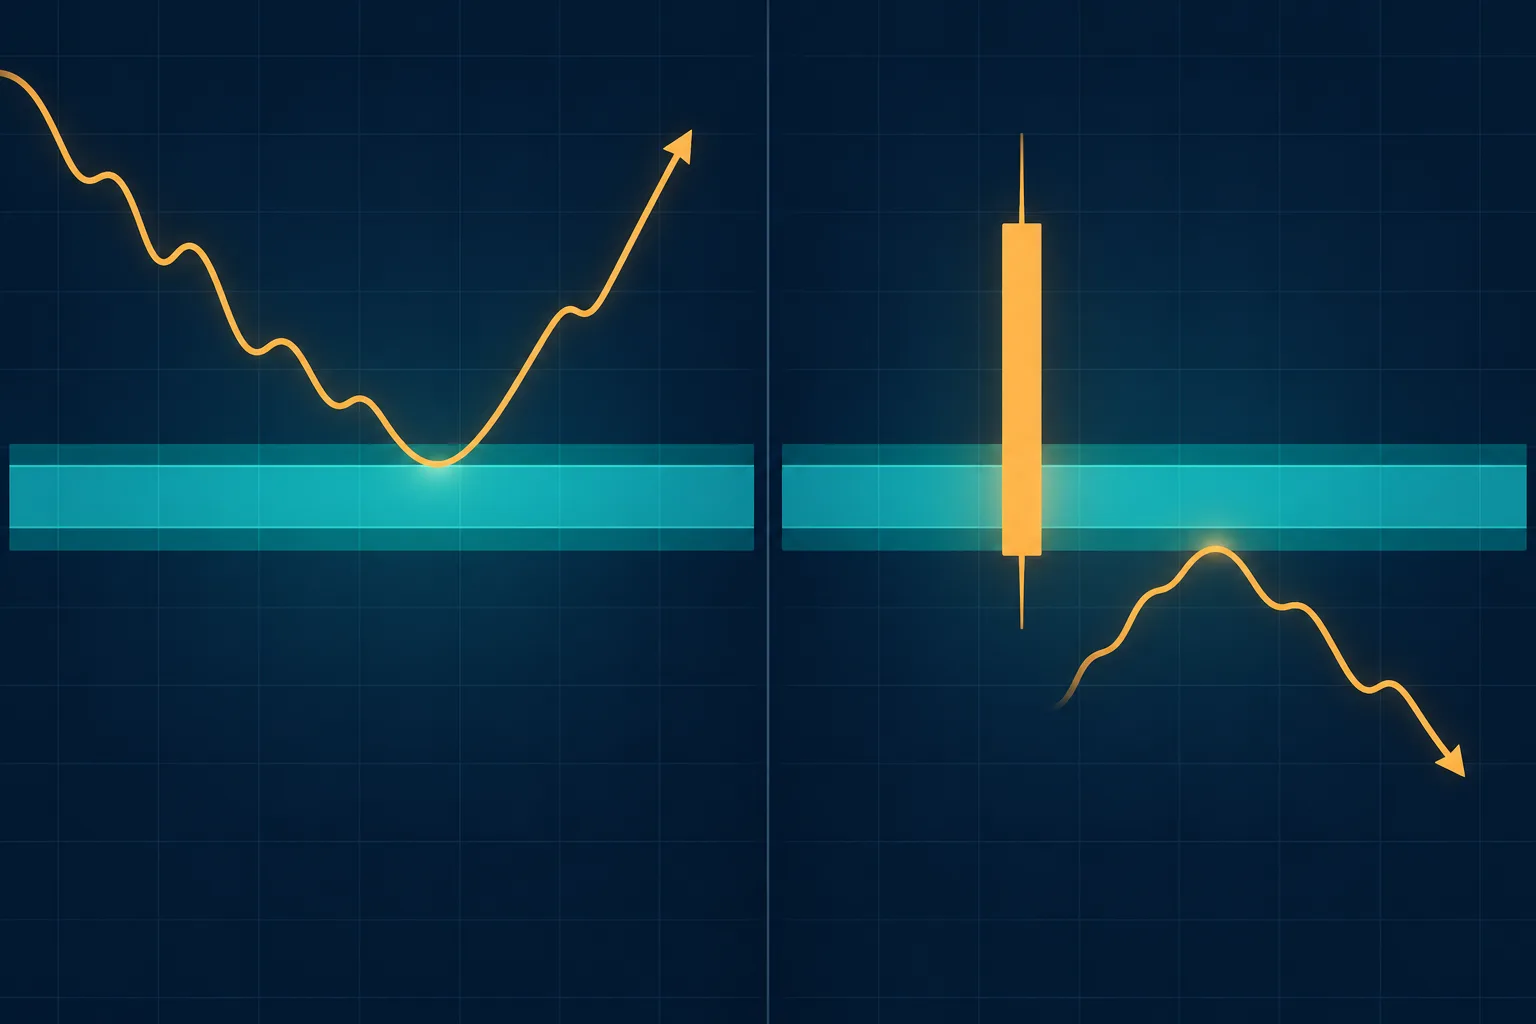
Risky setups share a few traits. The zone is narrow compared with typical candle ranges, so noise alone can cross it. The close through the zone is marginal. The zone sits in thin trading hours. Or the move through the zone was a single spike that reversed within a few candles.
How to Test the Idea with a Written Rule and a Journal
A rule that has not been tested is a story. A short written rule and a record of every occurrence turn it into a small dataset. The approach below is a proposal, not an established method.
- Write the rule. Fix the timeframe, minimum zone width, close-through definition, retest window, and invalidation condition before looking at results.
- Record every occurrence that matches the rule, including those with no retest and those that failed.
- Define the outcome in advance, such as whether the first close after a retest is back outside the zone, or the move measured in R, where R is the initial risk.
- Add a comparison. Run the same outcome measure on reference levels, such as the midpoint of an earlier candle at the same distance from price. Osler used this design, comparing published levels with 10,000 sets of arbitrarily chosen levels.
- Count the sample. Twelve successes in 20 occurrences is a 60% rate, yet the win rate guide shows that the 95% interval around it runs from roughly 39% to 78%.
In Trading Journl, a trade can carry a tag for the setup, an entry reason, and a chart screenshot, and the analytics break results down by tag, so each IFVG trade can be reviewed later against the written rule. The same fields can be kept on paper or in a spreadsheet. See what a trading journal records for the full list.
Limitations and Risks
The IFVG has no formal definition. Different charting tools and educators mark different zones from the same candles, so results from one source may not match another.
The role-reversal principle is documented, but its evidence is limited. A New York Federal Reserve study by Carol Osler tested support and resistance levels that six firms published daily for three currencies from January 1996 to March 1998. It found that the levels predicted intraday trend interruptions, with performance that varied across firms and currencies. That study used published horizontal levels in foreign exchange. It did not test fair value gaps or role reversal, so it neither confirms nor refutes the IFVG.
Concrete failure modes include the following.
- Whipsaw. Price closes through a zone, reverses, and closes back through it. The zone may flip twice in a few candles.
- No retest. Price may never return to the zone, so the signal produces no event to evaluate.
- Level proximity. A zone near the prior high, a round number, or a session open mixes several influences, so the IFVG cannot be isolated.
- Hindsight. Zones are easy to find on a finished chart. The test is whether they can be marked in real time under a fixed rule.
- Overfitting. Adjusting the width, the close rule, and the timeframe until the history looks good tends to produce a rule that fails on new data.
Nothing in this post is a performance claim. Past patterns do not indicate future results, and position size and acceptable loss need to be decided separately from any zone.
A Checklist Before Acting
- Is the underlying FVG defined by a written rule, with the zone edges recorded?
- Did a candle close through the zone, or only a wick, and does that match the written rule?
- Was the invalidation condition written before the trade, not after?
- Did the close happen during regular trading hours, or in a thin period?
- Is there a comparison, such as random levels at the same distance, to judge whether the zone adds information?
- Has the setup been tagged so each occurrence, including failures, is recorded?
- Are position size and maximum loss set independently of the zone?
For a fuller process around these checks, see the guide to building a trading plan.
Frequently Asked Questions
What Is the Difference Between an Inverse FVG and an Inversion FVG?
There is none in practice. Both names describe a fair value gap that price has closed through, after which the zone is watched in the opposite role. "IFVG" is the common abbreviation for either name.
How Is a Bullish IFVG Named?
Naming is not standardized, because the concept is community-defined. One convention names the IFVG by the original gap, so a bullish gap closed below is a "bullish FVG that inverted." Another names it by the zone's new role. State which convention the written rule uses so that journal entries stay consistent.
How Is an IFVG Different From a Breaker Block or an Order Block?
These are related community terms, and some educators describe them differently, and definitions vary. An order block is commonly described as the last candle before a strong move, marked as a zone where orders may have been placed. A breaker block is commonly described as an order block that price has broken through and that is then watched in the opposite role. An IFVG applies the same flip to a fair value gap instead of a candle.
Which Timeframe Is an IFVG Used On?
There is no standard timeframe. Educators apply the idea on a range of timeframes. The written rule should fix one timeframe, so that every occurrence in a journal is comparable.
Key Takeaways
An inverse fair value gap is a fair value gap that price has closed through, and it is a community-defined idea to be tested, not a proven signal.
- An IFVG is an FVG that a candle closes through against its original direction. "Inverse FVG" and "inversion FVG" mean the same thing.
- The role-reversal idea comes from classic support and resistance, where Murphy describes broken levels taking the opposite role after a significant penetration. Applying it to gap zones is a community extension.
- Results depend on settings. The FVG definition, the close-through rule, and the timeframe change which zones count.
- No peer-reviewed test of IFVGs was found. Osler tested published support and resistance levels in foreign exchange, which is related but different.
- A written rule, a record of every occurrence including failures, and a random-level comparison are the minimum needed to evaluate the idea.
Recording the zone, the rule that produced it, and the outcome of each IFVG trade makes it possible to review later whether the idea held up in a real sample.
References
- Murphy, J. J., Technical Analysis of the Financial Markets: A Comprehensive Guide to Trading Methods and Applications, New York Institute of Finance, 1999, Chapter 4, "Basic Concepts of Trend" (sections on the psychology of support and resistance and on how levels reverse their roles).
- Osler, C. L., "Support for Resistance: Technical Analysis and Intraday Exchange Rates," FRBNY Economic Policy Review 6(2), 53–68, July 2000. newyorkfed.org
For reference only: The information in this post is provided for general reference and does not constitute investment advice or a solicitation to trade. Your responsibility: Final investment decisions and their outcomes are entirely your own. No warranty: This information is not guaranteed to be accurate and cannot be used as a basis for legal liability for any investment result.