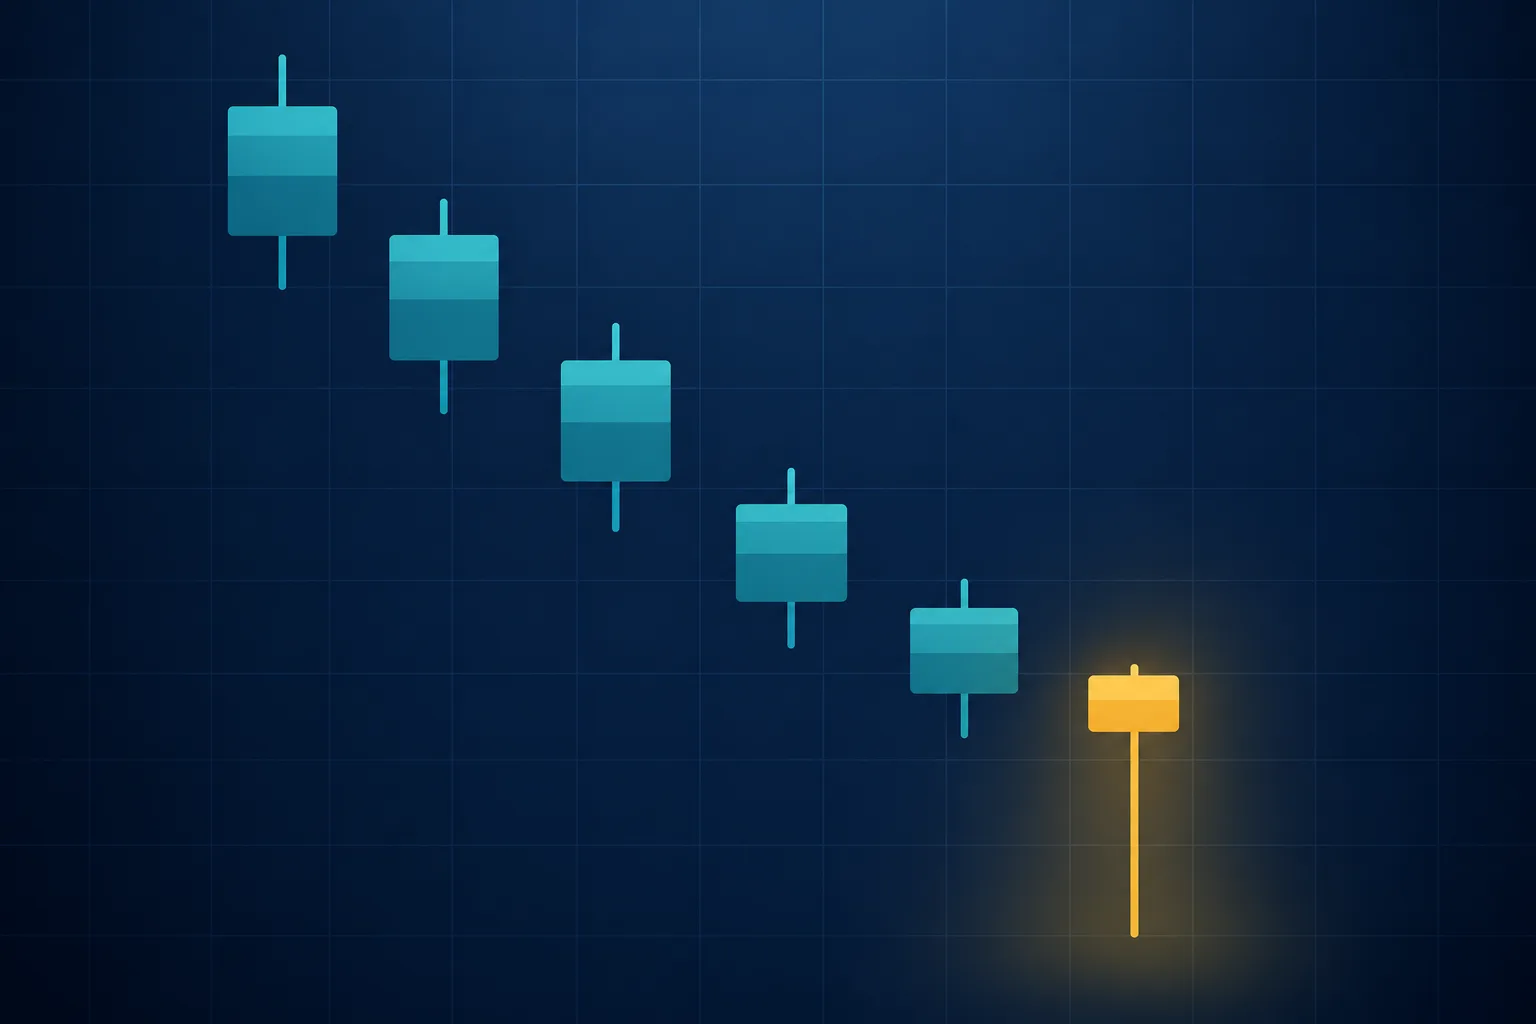
A hammer candlestick is a single-candle pattern with a small real body in the upper part of the session's range, a lower shadow at least twice as long as the body, and little or no upper shadow. When it appears after a decline, it is sometimes called a bullish hammer, and traders read it as a possible pause in selling: price fell during the session, then recovered to close near the high.
A hammer describes one session. It is not a forecast, and the shape alone does not decide what happens next. The same candle after an advance is called a hanging man, and the research reviewed below finds little evidence that either one predicts returns reliably on its own. This guide therefore treats the hammer as a prompt to check context, not as a reason to trade.
What Is a Hammer Candlestick?
A candlestick summarizes one period of trading with four prices: the open, the high, the low and the close. The body spans the open to the close. The thin lines above and below the body, called shadows, mark the high and the low. Marshall, Young and Rose describe the body as white when the close is above the open and black when it is below.
Steve Nison introduced candlestick charting to Western readers in his 1991 book Japanese Candlestick Charting Techniques. Marshall, Young and Rose, citing page 29 of that book, state the hammer's proportions: the lower shadow should be twice the height of the real body, with no upper shadow or a very short one. Bulkowski's pattern tests describe a lower shadow of at least two or three times the body and require a downward price trend before the pattern.
This guide adds a working rule for the body's position: the body sits in the upper third of the candle's total range. The rule follows from the other two. If the lower shadow is at least twice the body and the upper shadow is close to zero, the body can fill at most one third of the range.
Marshall, Young and Rose describe the logic as a decline to a new intraday low, followed by a rally that closes above the open. That is the theory, not a measured outcome.
Does the Color of a Hammer Matter? The Red Hammer Question
Color does not change the definition of a hammer. The criteria above describe proportions and location, and none of them mentions color. A red hammer, on charts where red marks a close below the open, has the same shape as a green one: the open and close both sit near the session high, and the long shadow points down.
Chart colors are a platform setting, so check which color your platform assigns to a close above the open. This post cites no study that measures a difference in outcomes between the two colors, so color is treated as secondary to the proportions, the prior decline and the next session.
Hammer, Hanging Man, Inverted Hammer and Dragonfly Doji
Four candles are often confused because each has one long shadow and a small body. The table separates them by body position, shadow direction and the trend that precedes them.
Bulkowski's identification guidelines agree with the table on shadow shape and trend for the first two rows and the last row. He describes the hanging man as a small-bodied candle atop a long lower shadow in an uptrend, and the dragonfly doji as a long lower shadow with a small body and no required trend. His version of the inverted hammer is stricter than the one-candle shape in the table: it needs a preceding tall black candle. The inverted hammer guide covers that shape, and the gravestone doji guide covers the mirror image of the dragonfly.
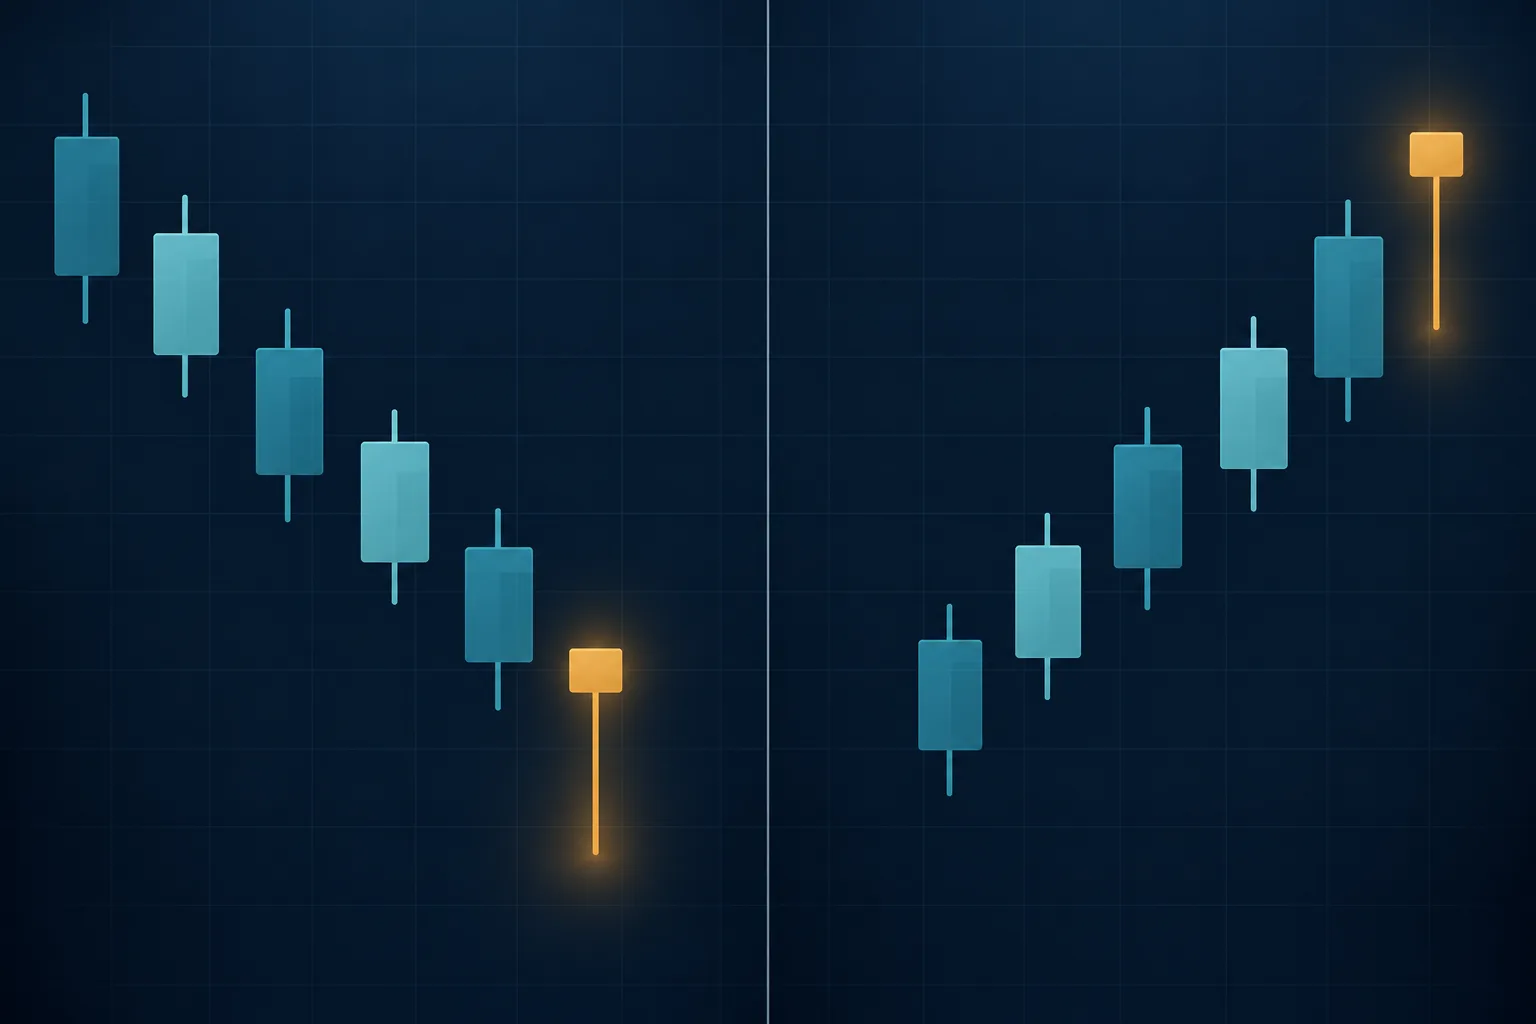
Hanging Man (Bearish Hammer): Same Shape After an Advance
A bearish hammer candle is the hanging man: the same proportions, but after an advance. The shape is identical, so only the preceding trend and the next session separate the two labels.
Bulkowski's page on the hanging man states that in theory it is a bearish reversal, but in his tests it acted as a bullish continuation 59 percent of the time. He calls that almost random, so the bearish label should not be read as a typical outcome.
How to Identify and Confirm a Hammer
Treat the candle as a checklist of measurements instead of a visual impression. Each step below can be answered with a number or a yes or no.
- Define the decline. "After a decline" needs a rule. Marshall, Young and Rose followed Morris and used a ten-day exponential moving average to determine the prior trend. Any consistent rule works, such as a lower low than five sessions earlier, provided it is written down before the trade.
- Measure the candle. Compute the body, the lower shadow and the upper shadow from the open, high, low and close. The formula is
lower shadow ÷ body ≥ 2, with the upper shadow close to zero. - Check the location. Note whether the low is near a prior swing low or a level that held earlier. A hammer in the middle of a range has less context.
- Wait for the next session. In the description used by Marshall, Young and Rose, prices continue to increase the next day once a reversal has occurred. A practical rule is a next-session close above the hammer's high.
- Compare volume. Record whether volume on the hammer session was higher than in recent sessions. This is a context check. This post cites no study showing that it improves outcomes.
- Set the stop and size before entry. A stop below the hammer's low is a common convention, and the long shadow makes that stop distant. The trading plan guide covers writing entry, stop and size down in advance.
Worked Example: A Hypothetical Hammer on a US Stock
Assume a hypothetical US stock, not a real quote, falls for several sessions. One daily candle then prints an open of 98.40, a high of 100.00, a low of 94.80 and a close of 99.80.
- Body: 99.80 − 98.40 = 1.40.
- Lower shadow: 98.40 − 94.80 = 3.60, or about 2.6 times the body.
- Upper shadow: 100.00 − 99.80 = 0.20.
- Range: 100.00 − 94.80 = 5.20, so the upper third begins at 98.27. The body's bottom, 98.40, is above that line.
The candle meets all three criteria. Suppose the next session closes at 101.10, above the hammer's high, which satisfies the confirmation rule in step 4. Entering at that close of 101.10 with a stop at 94.70, just below the hammer's low, puts risk at 6.40 per share, 6.3 percent of 101.10. A 2:1 target is 101.10 + 2 × 6.40 = 113.90. A risk budget of 250 USD divided by 6.40 gives 39.06, rounded down to 39 shares.
The wide stop is the practical cost of the shape. The risk-reward ratio guide and the risk/reward ratio calculator apply the same arithmetic to any entry, stop and target.
Market Notes: US Stocks and Crypto
For US stocks, a daily candle summarizes trading for the session. The SEC's investor bulletin states that regular trading hours are 9:30 a.m. to 4:00 p.m. Eastern Time. It also states that after-hours trading generally has less trading interest, wider spreads and more price volatility. If a chart includes extended-hours prints, a long lower shadow can reflect thin trading rather than buyers returning. Check how your data source builds the daily candle.
For crypto, trading runs around the clock, so a daily candle needs a boundary. On Binance's spot API, kline intervals are interpreted in UTC by default, and a timeZone parameter shifts them. A chart whose day starts at a different hour can show a hammer where a UTC chart shows none, and the reverse. Confirm which boundary the chart uses before comparing signals across platforms.
Timeframe matters as well. The academic study below tested daily candles on large US stocks. Bulkowski's page does not state its sample. Neither source covers intraday, crypto or small-cap hammers.
Stronger vs. Weaker Hammer Setups
No source cited here shows that any hammer setup outperforms another. The terms below describe how well defined a setup is, which makes it easier to test and to review afterward.
A hammer is easier to defend when four things hold. The preceding decline satisfies a written rule, the lower shadow is well above twice the body, the low sits near a level that held before, and the next session closes above the hammer's high. Each can be checked, recorded and compared across many trades.
A hammer is harder to defend when no clear decline came before it, when it forms inside a sideways range, when the chart includes thin extended-hours prints, or when the next session closes below the hammer's low. A string of hammers inside one decline is a reason to question the rule being used.
Limitations and Risks
What the Research Shows
Marshall, Young and Rose (2006) tested candlestick rules on the stocks that were in the Dow Jones Industrial Average between 1992 and 2002. Their companion paper describes 14 single-line and 14 reversal patterns, a ten-day holding period, and entry at the close on the day after the signal. They used a bootstrap method alongside t-tests. They found no evidence that candlestick signals predict returns, and concluded that neither bullish nor bearish patterns beat chance.
The hammer figures come from that companion paper. The statistical tests used daily returns during the ten-day holding period, so each signal contributes ten returns. The hammer produced 57 signals, and 49.5 percent of the daily returns that followed were above zero. The t-statistic against the unconditional mean daily return was 0.377, which is not significant. The hanging man produced 84 signals, with a t-statistic of 0.384, also not significant. Its mean daily return after the signal was positive, the opposite of its bearish label.
The authors wrote that basing trading decisions solely on these techniques does not seem sensible, while noting that they cannot rule out a role alongside other methods. The sample is large-cap US stocks in one decade. It says nothing directly about crypto, small caps or intraday charts.
Bulkowski's figures point the same way with a different method. His page reports that the hammer acted as a bullish reversal 60 percent of the time, which he describes as not far from random at 50 percent. The page does not state a sample period, so the figure is not directly comparable with the academic study.
Failure Modes
- No prior decline. A hammer-shaped candle without a measurable decline is a different situation, and the pattern's logic does not apply.
- No confirmation. A hammer followed by a close below its low fails the confirmation rule, and a stop below that low would be reached.
- Wide stop distance. The long lower shadow forces either a distant stop or a stop inside the shadow, where ordinary volatility can reach it.
- Data differences. Extended-hours prints and different daily boundaries for crypto change which candles qualify.
A single trade says almost nothing about a pattern. To judge a personal sample, tag each hammer-based trade so the set can be pulled up later. In Trading Journl, trades can be tagged and reviewed with entry and exit markers on the price chart, which supports comparing the hammer trades against the rest of a trading journal.
A Checklist Before Acting on a Hammer
- Did a decline that meets a written rule come before the candle?
- Is the lower shadow at least twice the body, with little or no upper shadow?
- Does the body sit in the upper third of the candle's range?
- Is the low near a prior swing low or a level that held?
- Did the next session close above the hammer's high?
- Does the daily candle exclude thin extended-hours prints, or have I accounted for them?
- For crypto, do I know the chart's daily boundary and whether it is UTC?
- Are the stop, size and target written down, and is the reward large enough for the distance to the stop?
- Will this trade be tagged so that I can review the sample later?
Frequently Asked Questions
Is a bearish hammer the same as a hanging man?
Yes. "Bearish hammer" is the common name for the hanging man: the same shape as a hammer, appearing after an advance instead of a decline. The shape is identical, and only the preceding trend differs.
Is a hammer candlestick reliable?
Not on its own, in the sources cited here. See the Limitations and Risks section for the study and Bulkowski figures.
Key Takeaways
A hammer is a measurable one-candle shape whose meaning depends on the trend before it and the session after it.
- A hammer has a small body in the upper third of the range, a lower shadow at least twice the body, little or no upper shadow, and follows a decline.
- The same shape after an advance is a hanging man. Body color matters less than proportions and context.
- Confirmation, such as a next-session close above the hammer's high, and a written definition of the decline make the setup testable.
- A study of Dow Jones Industrial Average stocks from 1992 to 2002 found no significant predictive value for the hammer or the hanging man.
- Check how daily candles are built: extended-hours prints for US stocks and the UTC boundary for crypto.
If you act on a hammer, record the decline rule, the measurements, the confirmation and the stop, so the decision can be reviewed against the outcome later.
References
- Steve Nison, Japanese Candlestick Charting Techniques: A Contemporary Guide to the Ancient Investment Techniques of the Far East, New York Institute of Finance, 1991 (hammer criteria as cited from p. 29 by Marshall, Young and Rose)
- Ben R. Marshall, Martin R. Young and Lawrence C. Rose, "Candlestick technical trading strategies: Can they create value for investors?", Journal of Banking & Finance, 30(8), 2303–2323, 2006
- Ben R. Marshall, Martin R. Young and Lawrence C. Rose, "Market timing with candlestick technical analysis", Journal of Financial Transformation, 20, 18–25, 2007 (hammer and hanging man figures, sample and method)
- Thomas Bulkowski, "Bulkowski on the Hammer Candle Pattern", ThePatternSite.com, retrieved 2026-10-01
- Thomas Bulkowski, "Bulkowski on the Hanging Man Candle Pattern", ThePatternSite.com, retrieved 2026-10-01
- Thomas Bulkowski, "Bulkowski on the Dragonfly Doji Candle Pattern", ThePatternSite.com, retrieved 2026-10-01
- Thomas Bulkowski, "Bulkowski on the Inverted Hammer Candle Pattern", ThePatternSite.com, retrieved 2026-10-01
- SEC Office of Investor Education and Advocacy, "Investor Bulletin: After-Hours Trading", U.S. Securities and Exchange Commission, retrieved 2026-10-01
- Binance, "Spot API documentation, Market data endpoints: Kline/Candlestick data" (describes Binance's own kline interval and time zone behavior), developers.binance.com, retrieved 2026-10-01
For reference only: The information in this post is provided for general reference and does not constitute investment advice or a solicitation to trade. Your responsibility: Final investment decisions and their outcomes are entirely your own. No warranty: This information is not guaranteed to be accurate and cannot be used as a basis for legal liability for any investment result.