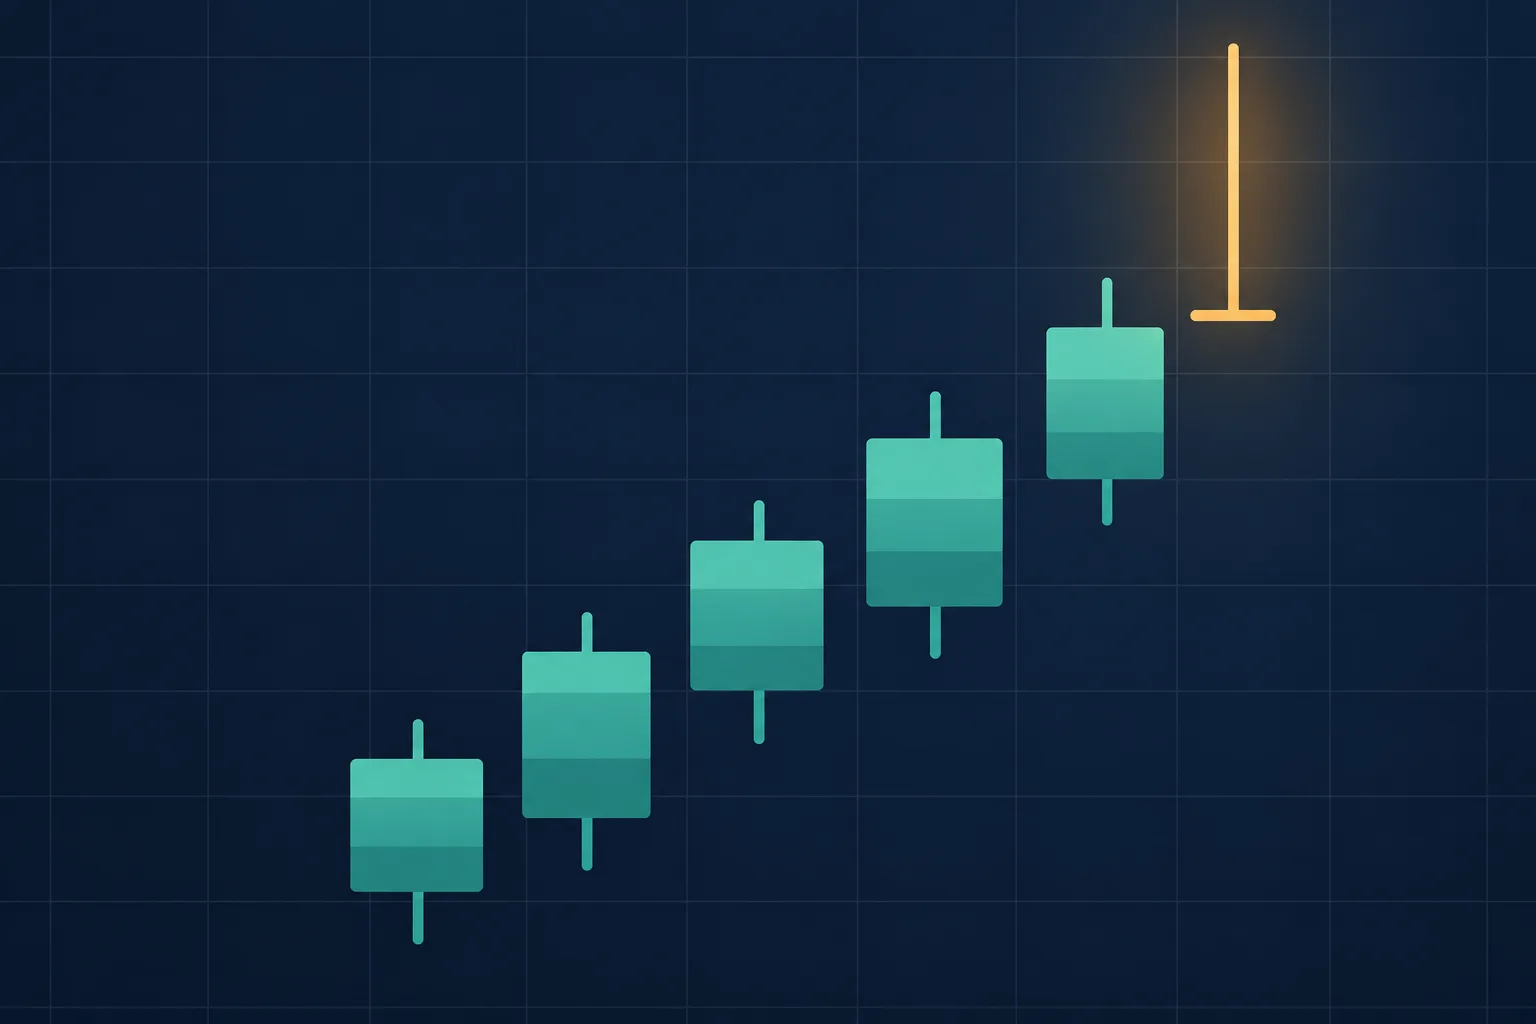
A gravestone doji is a single candlestick in which the open, close and low sit at nearly the same price, with a long upper shadow above them. It records a session in which buyers pushed price well higher and sellers then returned it to where it started. When it appears after an advance, traders often read it as a warning that the advance lost momentum. Candlestick literature classes it as a bearish line.
That reading is a hypothesis, not a forecast. A gravestone doji is one candle, and it says nothing by itself about the next session. In the Massey study (Marshall, 2005), a test on large US stocks, signals from this pattern were followed by returns that did not differ significantly from the unconditional mean return. The sections below cover how to identify the candle, how it differs from similar shapes, how to confirm it, and where it fails.
What Is a Gravestone Doji?
A gravestone doji is a candlestick whose open and close are at the low of the session or very close to it. Price rallies during the session, then declines to close at or near the opening price (the Massey study, Marshall, 2005, Appendix One). On a chart, the thin vertical line with a near-zero body at the bottom looks like an inverted letter T.
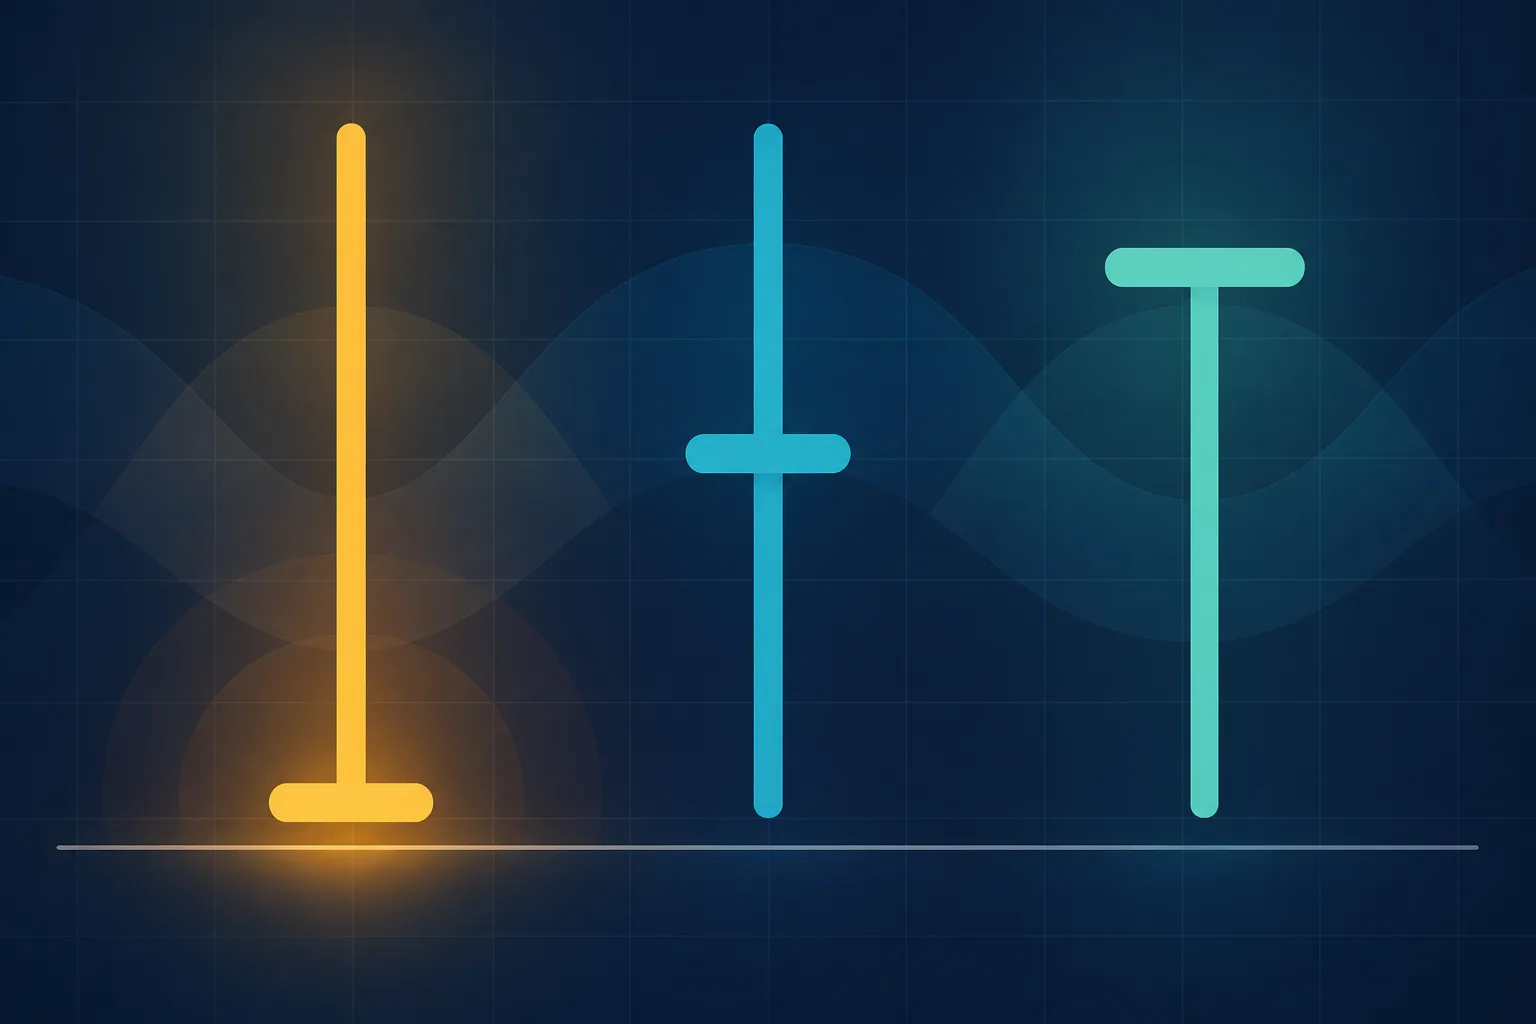
The anatomy has three parts, and a simple way to apply it is to measure each part as a share of the full high-to-low range:
- Real body: essentially absent, because the open and close are nearly equal.
- Upper shadow: long, usually most of the full range.
- Lower shadow: essentially absent, because the open, close and low are nearly equal.
No universal threshold defines "nearly equal", and that is this guide's own observation. The Massey study notes that practitioner books fix some parameters precisely, and it tested changing all of its candle parameters by 20 percent. Write down your tolerance before looking at charts. For example, require the body and the lower shadow to each be no more than 5 percent of the range. That percentage is an illustrative choice, not a standard.
Gravestone Doji vs. Similar Candles
The table separates similar candles by anatomy and by the context in which each is conventionally discussed.
A hammer is a different candle again. Its long shadow points down, and Nison's guideline, as cited in the Massey study, is a lower shadow about twice the height of the real body with a short or absent upper shadow. The hammer candlestick guide covers it.
How to Read and Confirm a Gravestone Doji
Treat a gravestone doji as a prompt to look closer, not as an instruction to act. Two checks turn the shape into something testable.
Check the Prior Move
The shape describes price rising and then returning to its open. That story means more after a sustained advance than inside a sideways range, where intraday spikes and reversals are routine. Compare the doji with the preceding sessions. Did price make a series of higher highs, and did the doji probe above the recent high?
The Massey study describes candlestick books as treating single lines such as this one as informative regardless of the underlying trend. The advance-first convention is therefore a refinement, and the study did not test it for this candle. Treat the context filter as an assumption to check in your own records.
Define Confirmation Before the Next Session
Confirmation means waiting for a later candle to support the reading. Because a doji is only one candle, any confirmation rule is a choice. Common examples are a next session that closes below the doji low, or a close below the low of the two candles before it. Pick the rule before the next candle forms, otherwise the choice tends to follow the outcome. A written trading plan is a natural place to record it.
Hypothetical Worked Example: US Stock
The numbers below are hypothetical. A stock called XYZ rises from 92.00 to 104.00 over eight daily sessions. On the ninth session it prints:
- Full range: 108.10 − 104.10 = 4.00.
- Real body: 104.25 − 104.20 = 0.05, which is 1.25 percent of the range.
- Lower shadow: 104.20 − 104.10 = 0.10, which is 2.5 percent of the range.
- Upper shadow: 108.10 − 104.25 = 3.85, which is 96.25 percent of the range.
Under a 5 percent tolerance, the candle qualifies. If the confirmation rule is a next close below 104.10, a close at 102.80 would confirm it and a close at 105.60 would not.
The arithmetic also shows a risk-measurement problem. If the doji high of 108.10 were used as the level that invalidates the reading, the distance from the doji low is 4.00 per share, about 3.8 percent of the price. Measured from the confirming close of 102.80, the distance is 5.30, about 5.2 percent. A long upper shadow places that level far away. A risk/reward calculator can show how that distance affects the ratio, and the risk/reward ratio guide explains the metric.
Market Notes: US Stocks and Crypto
US stocks trade in a regular session, and a daily candle can include or exclude pre-market and after-hours trades depending on the chart setting. A long shadow that exists only because of a thin extended-hours print is a weaker observation than one formed in regular trading.
Crypto trades around the clock, so a daily candle has no natural close. Its boundary is a convention set by the venue or the chart. Binance's spot API documentation states that kline intervals follow UTC by default and that a time zone parameter can shift them (Binance, Spot API documentation, Kline/Candlestick data). Other platforms may use a different boundary.
The boundary changes what a pattern looks like. Take a hypothetical coin that opens a UTC day at 60,000, rallies to 62,400 by mid-afternoon, and drifts back to 60,050 by midnight without ever trading below 59,950. That UTC daily candle is a gravestone doji. Suppose a platform splits the same 24 hours at a boundary that falls between the afternoon high and the fade. The rally then lands in one candle as a strong up body, and the fade lands in the next as a down body. Neither candle is a doji. Confirm which convention a screenshot or alert used.
Reliable vs. Risky Gravestone Dojis
None of the studies cited here show a setup that reliably works, so these points describe a cleaner observation, not a predictor of profit.
- Cleaner: the upper shadow is most of a range that is wide compared with recent sessions, the candle probes above a recent high after a sustained advance, and the stock is liquid. The Massey study argues that candlestick signals are less useful in thinly traded stocks, whose prices can be moved by as little as one market participant.
- Riskier: the candle forms in the middle of a range, the tolerance was loosened after the fact, or the shadow comes from a thin extended-hours or low-volume overnight print.
- Invalidated: the next candle opens above the doji high and keeps rising.
Limitations and Risks
The test cited here that isolates this candle is not encouraging. The Massey study tested 14 candlestick single lines and 14 reversal patterns on the 35 stocks that were in the Dow Jones Industrial Average during 1992–2002. Under the base case, positions were entered at the next day's open and held for ten days. The gravestone doji produced 191 signals. The mean daily log return after those signals was 0.0009 (0.09 percent), and the t-statistic comparing it with the unconditional mean was 1.301, not significant at the 5 percent level. The conditional mean was positive, the opposite of the bearish expectation.
The share of positive daily returns was 46.44 percent. The thesis notes that a share below 50 percent is the direction candlestick theory expects for a bearish line. It treats the figure as indicative only, because the column makes no comparison with unconditional returns and ignores the size of returns. The author concluded that candlestick analysis showed no evidence of outperforming the market (Marshall, 2005).
This result has limits. It covers daily candles on large US stocks over one decade, with no trend filter for single lines. It does not test the advance-first version of the pattern, crypto, or intraday charts. It does show that a bearish label on a candle is not evidence of a downward move. The method itself is old: Nison's 1991 book introduced candlestick charting to Western traders, and the researchers trace its origin to Japanese rice trading in the 1700s (Marshall, Young and Rose, 2007).
Other research is mixed. A ten-year study of 50 large Thai stocks found that the mean returns of most candlestick reversal patterns were not statistically different from zero. Filtering with Stochastics, RSI or the Money Flow Index generally did not improve results (Tharavanij, Siraprapasiri and Rajchamaha, 2017). A study of Taiwanese stocks reported that three bullish two-day patterns were profitable (Lu, Shiu and Liu, 2012). Neither study tested the gravestone doji itself, so the Massey study remains the only test cited here that isolates this candle.
Concrete failure modes follow:
- A single candle is a tiny sample. A pattern seen a handful of times supports no conclusion about its reliability.
- Strong trends. A rally can print several long upper shadows and continue.
- Wide invalidation distance. A long shadow places the natural invalidation level far from the entry.
If you track this setup, record the prior move, the measured proportions, the confirmation rule and the result for every occurrence, not only the ones that worked. In Trading Journl, tags, the entry reason and a chart screenshot can hold those details, so that results can be grouped by setup during review. A trading journal only helps when the sample is large enough, and a streak of confirmations over ten occurrences is weak evidence.
A Checklist Before Acting
- Is the open, close and low within the tolerance you wrote down before looking?
- Is the upper shadow most of a range that is wide compared with recent sessions?
- Did the candle form after a sustained advance rather than inside a range?
- Is the shadow built from regular trading rather than a thin extended-hours or low-volume print?
- Did you define the confirmation rule before the next candle formed, and did the next candle meet it?
- Do you know the invalidation level and the position size at that distance?
- Does your journal contain earlier occurrences of this setup, including the ones that failed?
Frequently Asked Questions
Is a gravestone doji bullish or bearish?
It is conventionally classed as bearish, because price rallied and then gave back the whole move. Its meaning depends on context and on confirmation by later candles, and the Massey test found no significant bearish edge for the candle on its own.
Key Takeaways
A gravestone doji is a candle shape that describes a failed rally within one session, and its value as a signal depends on context and confirmation.
- It has open, close and low nearly equal at the bottom of the range, a long upper shadow and essentially no lower shadow.
- It differs from a shooting star by having no visible body, and from a dragonfly doji by being its mirror image.
- It is most meaningful after an advance, though that filter is a convention and the cited study did not test it.
- In the Massey study of 35 large US stocks, 191 gravestone doji signals were followed by returns that did not differ significantly from the unconditional mean return.
- Crypto daily boundaries and US extended-hours settings change which candles qualify, so confirm the chart convention.
Writing down why you treated a candle as a gravestone doji, and what happened next, makes it possible to review later whether the pattern deserves a place in your plan.
References
- Benjamin R. Marshall, "Candlestick Technical Trading Strategies: Can They Create Value for Investors?", PhD thesis, Massey University, 2005
- Ben R. Marshall, Martin R. Young and Lawrence C. Rose, "Market Timing with Candlestick Technical Analysis", Journal of Financial Transformation, 20, 18–25, 2007
- Piyapas Tharavanij, Vasan Siraprapasiri and Kittichai Rajchamaha, "Profitability of Candlestick Charting Patterns in the Stock Exchange of Thailand", SAGE Open, 2017
- Tsung-Hsun Lu, Yung-Ming Shiu and Tsung-Chi Liu, "Profitable candlestick trading strategies—The evidence from a new perspective", Review of Financial Economics, 21(2), 2012
- Binance, "Spot API documentation: Market Data Endpoints (Kline/Candlestick data)", retrieved 2026-10-02 (cited only for how Binance sets kline intervals and its time zone parameter)
For reference only: The information in this post is provided for general reference and does not constitute investment advice or a solicitation to trade. Your responsibility: Final investment decisions and their outcomes are entirely your own. No warranty: This information is not guaranteed to be accurate and cannot be used as a basis for legal liability for any investment result.