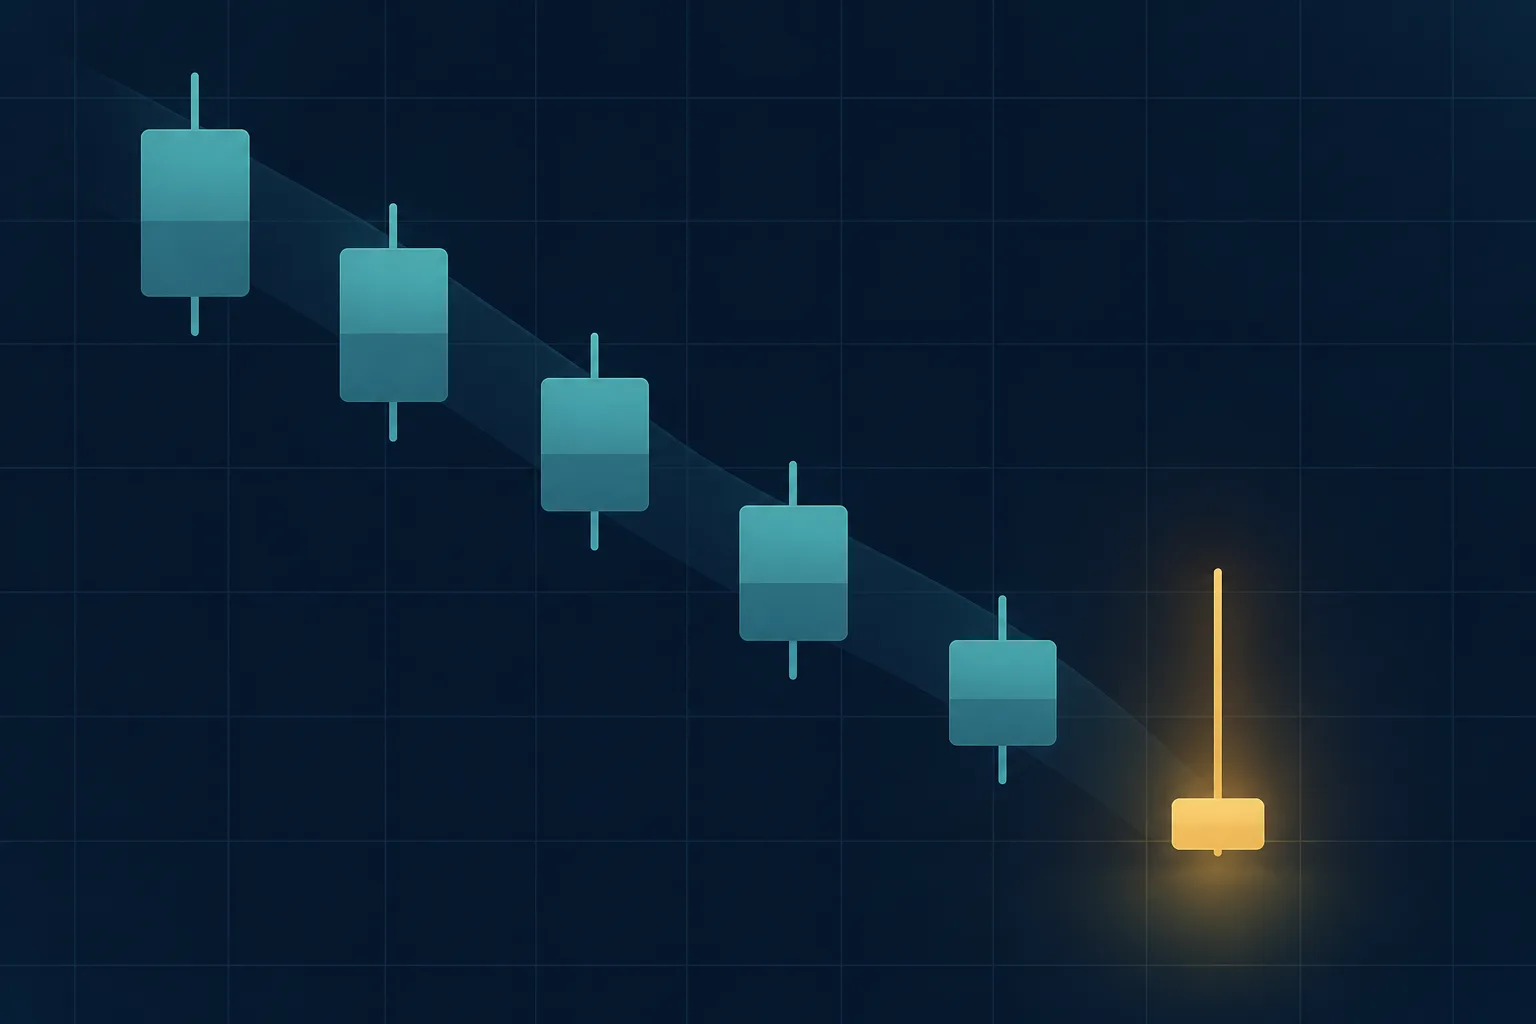
An inverted hammer candlestick is a single candle after a decline with a small real body near the low, an upper shadow at least twice the body, and little or no lower shadow. Buyers pushed price well above the open during the session, but sellers returned it close to the open by the close.
In candlestick theory, the candle is read as a possible sign that selling pressure is fading, but it is incomplete on its own. The long upper shadow also records a rejection of higher prices, and the same shape after an advance is a shooting star with the opposite reading. Published testing on large US stocks found candlestick signals were not generally profitable, so the inverted hammer is best treated as a prompt to look for confirmation and to define risk, not as a trade trigger.
What Is an Inverted Hammer Candlestick?
A candlestick records four prices for one period: the open, the high, the low and the close. The real body spans the open to the close, and the shadows, also called wicks, extend from the body to the high and to the low. Steve Nison introduced candlestick analysis to Western traders in Japanese Candlestick Charting Techniques in 1991, as noted by Marshall, Young and Rose (2007).
This guide uses four working rules to classify the candle:
- Context: a decline precedes the candle. No single standard defines how long or how steep the decline must be, so write the rule down before scanning charts.
- Body: small, with the whole body in the lower third of the candle's range from low to high.
- Upper shadow: at least twice the length of the body.
- Lower shadow: little or none, meaning no more than 10% of the candle's range.
The shape rules do not depend on whether the close is above or below the open, and they are working rules, not a universal standard. Nison's hammer rule, as relayed by Marshall, Young and Rose (2007), asks for a lower shadow twice the height of the real body and no or a very short upper shadow (Nison, 1991, p. 29). The inverted hammer is the mirror image of that shape, so this guide applies the same two-to-one ratio to the upper shadow. Other sources may use different thresholds, so record the one you apply.
Candlestick theory explains both the appeal and the weakness of the shape. Price rose well above the open, which is the first visible demand after a decline. Price then fell back, and the close in the lower third of the range means sellers finished the session in control. For that reason the candle is treated as unconfirmed until later candles support it.
Inverted Hammer vs Shooting Star
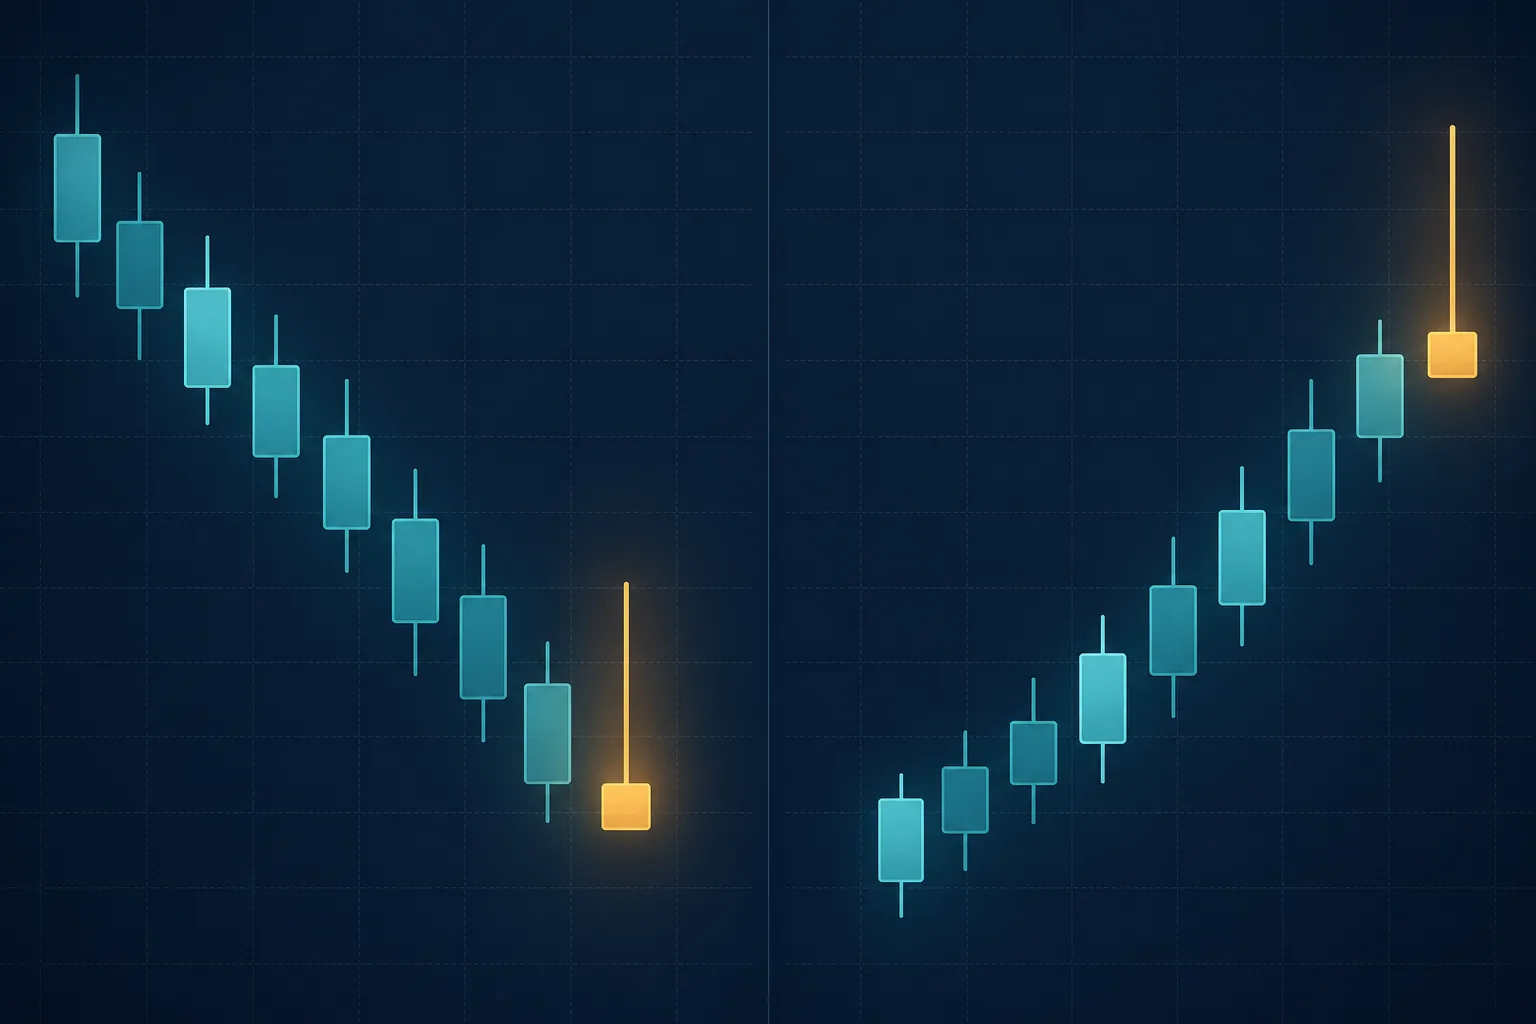
The inverted hammer and the shooting star have identical geometry: a small real body near the low, an upper shadow at least twice the body, and little or no lower shadow. The only difference is the trend before the candle. After a decline the shape is an inverted hammer, a candidate for a bullish reversal. After an advance it is a shooting star, a candidate for a bearish reversal.
The name depends on the preceding trend, so a candle cannot be classified from its shape alone. Define the trend rule first, for example a minimum number of lower closes, and apply it to both patterns. The reading differs because the same failed rally means different things. After a decline, the push higher is the first sign of demand. After an advance, the inability to hold new highs suggests buyers are tiring. Both readings are hypotheses that later candles must support.
Inverted Hammer vs Hammer vs Gravestone Doji
The hammer candlestick guide covers the vertical mirror image of the inverted hammer, and the gravestone doji guide covers the candle with almost no body at the low.
The boundary between an inverted hammer and a gravestone doji is a matter of degree. When the body shrinks to almost nothing and the close sits at the low, the candle is closer to a gravestone doji. State your threshold in advance rather than judging each case by eye.
How to Read and Confirm an Inverted Hammer
Confirmation means waiting for later price action to support the reversal read. Choose the test before looking at the chart, because choosing it afterward invites hindsight. Work through the candle in this order.
- Identify the decline using your written trend rule.
- Measure the candle: the body, the upper shadow and the lower shadow, and where the body sits in the range.
- Mark the candle's high, its close and its low.
- Apply one confirmation test to the next candle. Roughly from least to most strict, the tests are: (a) it closes above the inverted hammer's close; (b) it opens above the inverted hammer's body and closes above its own open; (c) it closes above the inverted hammer's high.
- Define the failure level before acting, for example a close below the inverted hammer's low. The trading plan guide covers writing the invalidation condition down.
Confirmation has a cost. Entering after the next candle places the entry farther from the low, so a stop below the pattern is wider and the risk-reward ratio is lower than it would have been at the low.
Example 1: A US Stock (Hypothetical)
These prices are hypothetical. Shares of XYZ fall from $52.00 to $44.30 over eight sessions. The next session prints an open of $44.30, a high of $46.10, a low of $44.20 and a close of $44.60.
- Range: $46.10 − $44.20 = $1.90. Body: $44.60 − $44.30 = $0.30.
- Upper shadow: $46.10 − $44.60 = $1.50, which is 5.0 times the body.
- Lower shadow: $44.30 − $44.20 = $0.10. The top of the body sits at 21% of the range, inside the lower third.
The candle passes every rule. Suppose the following session opens at $44.70, above the body, and closes at $46.40. That close is above its own open and above the $46.10 high, so it passes all three tests, including the one that is roughly the strictest. A close at $44.40, below the inverted hammer's close, passes none and leaves the pattern unconfirmed, and a close below $44.20 marks it as failed.
Example 2: A BTCUSDT Daily Candle (Hypothetical)
These prices are also hypothetical. After a decline in BTCUSDT, a daily candle opens at 58,200 USDT, reaches a high of 60,400, a low of 58,000 and a close of 58,700.
- Range: 60,400 − 58,000 = 2,400. Body: 58,700 − 58,200 = 500.
- Upper shadow: 60,400 − 58,700 = 1,700, which is 3.4 times the body.
- Lower shadow: 58,200 − 58,000 = 200, or 8% of the range. The top of the body sits at 29% of the range.
The candle qualifies. If the next daily candle closes at 58,400, below the inverted hammer's close, no confirmation test is met.
Market Notes
US stocks trade outside regular hours. The SEC's page on after-hours trading risks says that stocks with limited trading activity can show greater price fluctuations than during regular trading hours. If a chart includes extended-hours trades, a long upper shadow may reflect a few trades in thin conditions.
Crypto trades around the clock, so a daily candle depends on where the exchange draws the day, and the same price action can produce a different candle on a different boundary. The Binance spot API documentation states that the timeZone parameter of its kline endpoint defaults to UTC, and that a provided time zone changes how kline intervals are interpreted.
Reliable vs. Risky Inverted Hammers
The following traits make an inverted hammer easier to defend in a later review. They describe the quality of the setup, not a measured success rate.
- The decline is clear under a written trend rule and spans several candles.
- The upper shadow is three or more times the body, so the proportions pass with room to spare.
- The confirmation test and the failure level were set before the next candle formed.
The following traits make it harder to defend.
- The upper shadow only just reaches twice the body, or the body drifts toward the middle of the range.
- The market was moving sideways, so no decline existed for the pattern to reverse.
- The confirmation test was chosen after the next candle formed.
- The shadow was built in thin trading, such as extended hours or a small altcoin.
What the Evidence Says
Marshall, Young and Rose (2006) tested candlestick signals in the Journal of Banking & Finance. Their data covered stocks in the Dow Jones Industrial Average from 1992 to 2002. A companion paper by the same authors in the Journal of Financial Transformation reports 14 single-candle signals and 14 reversal patterns, a ten-day holding period, and entry at the close of the day after the signal. Its abstract states that "these strategies are not generally profitable when applied to large U.S. stocks."
The tables in the companion paper include two shooting star variants, white and black. After 520 white and 465 black shooting star signals, average returns were slightly higher than the unconditional average, which is the opposite of the bearish expectation, but the t-statistics of 0.23 and 0.71 were not statistically significant. The hammer, with 57 signals, had a t-statistic of 0.38, also not significant. The signal list has no separate inverted hammer. The paper treats the shooting star as a single line, so its signals do not appear to have been conditioned on a prior advance, and its exact definition may differ from the one used in this guide.
The paper also reports bootstrap tests, and none showed that candlestick lines or patterns predicted price changes. These findings have limits. The sample is large-cap US stocks on daily candles over eleven years, and the paper defined the prior trend for reversal patterns with a ten-day exponential moving average. The results show that a mechanical rule did not beat chance in that sample, not that the pattern is useless in every market.
Limitations and Risks
The shape is subjective at the margin. Whether a decline counts, and whether a shadow is twice the body, depends on thresholds that differ between traders and charting tools, so two people can classify the same candle differently.
A rejection can continue. The long upper shadow shows that sellers overwhelmed buyers during the session. If the next candle opens lower and closes lower, the decline has resumed, and a trader who anticipated a reversal is positioned against the move.
Small samples mislead. A handful of confirmed inverted hammers on one symbol says little about the pattern. Tagging pattern trades in a journal such as Trading Journl and reviewing the entry markers on the chart makes it possible to count how many tagged pattern trades were confirmed and how those trades ended. The trading journal guide describes what to record.
A Checklist Before Acting
- Is there a decline that meets a trend rule written before the chart was opened?
- Is the real body small and entirely in the lower third of the candle's range?
- Is the upper shadow at least twice the body, and the lower shadow no more than 10% of the range?
- Was the confirmation test chosen before the next candle formed?
- Has the next candle passed that test?
- Is there a failure level, and is the loss at that level acceptable?
- Does the chart include extended-hours trades or a thin market that could have created the shadow?
- Will the setup be recorded, including whether it was confirmed, so the outcome can be reviewed?
Frequently Asked Questions
Is an inverted hammer bullish or bearish?
Neither by shape alone. After a decline it is classed as a bullish reversal candidate, and after an advance the same shape is a shooting star, a bearish candidate. In both cases the next candles help set the reading. In a journal, record confirmed and unconfirmed cases separately so that each group has its own count.
Does an inverted hammer work on any timeframe?
The geometry can be measured on any timeframe, and Binance's documentation lists kline intervals from one second to one month. The evidence cited here covers daily candles only, so it does not address shorter timeframes. A one-minute candle contains far fewer trades than a daily candle, so single orders can have a larger effect on the shadow.
Does the color of an inverted hammer matter?
No cited study compares colors. The shape rules in this guide depend on proportions and context, not on whether the close is above or below the open. A candle that meets the proportions after a decline is classified the same way either way, and the confirmation test then does the work.
Key Takeaways
The inverted hammer is a defined shape with a context requirement and an unresolved reading until confirmation arrives.
- An inverted hammer has a small body in the lower third of its range, an upper shadow at least twice the body, little or no lower shadow, and follows a decline.
- The same shape after an advance is a shooting star, so the preceding trend sets the name and the reading.
- The candle is best treated as unconfirmed until later candles support it, and the confirmation test and failure level should be fixed before the next candle forms.
- In a published test on large US stocks from 1992 to 2002, candlestick signals were not generally profitable.
- Thin trading and the exchange's day boundary can change the shape of the candle in US stocks and crypto.
If a pattern leads to a trade, recording the decline rule, the measurements, the confirmation test and the failure level makes it possible to review later whether the read was sound.
References
- Steve Nison, Japanese Candlestick Charting Techniques: A Contemporary Guide to the Ancient Investment Techniques of the Far East, New York Institute of Finance, 1991 (hammer rule and 1991 introduction as cited by Marshall, Young and Rose)
- Ben R. Marshall, Martin R. Young and Lawrence C. Rose, "Candlestick technical trading strategies: Can they create value for investors?", Journal of Banking & Finance, 30(8), 2303-2323, 2006
- Ben R. Marshall, Martin R. Young and Lawrence C. Rose, "Market timing with candlestick technical analysis", Journal of Financial Transformation, 20, 18-25, 2007
- U.S. Securities and Exchange Commission, "After-Hours Trading: Understanding the Risks", SEC.gov, November 3, 2008, retrieved 2026-10-01
- Binance, "Binance Spot API Documentation, REST API: Kline/Candlestick data", GitHub, retrieved 2026-10-01 (describes Binance's own endpoint)
For reference only: The information in this post is provided for general reference and does not constitute investment advice or a solicitation to trade. Your responsibility: Final investment decisions and their outcomes are entirely your own. No warranty: This information is not guaranteed to be accurate and cannot be used as a basis for legal liability for any investment result.